
Adding Fractions with Different Denominators
Loading the math board and drawing, please wait…
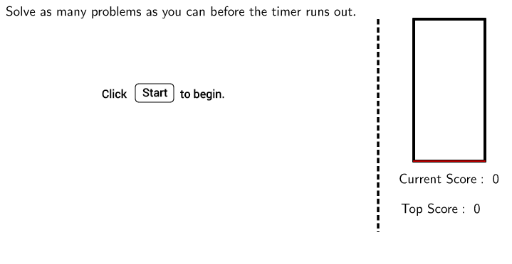
This example demonstrates how to add fractions with different denominators using GeoGebra, enhancing understanding through dynamic visualization. Core math concepts include fraction addition, handling different denominators, and geometric representation (polygons, line segments, area). Construction highlights involve commands like Polygon, Segment, Textfield, Random, and objects such as Timer, Instructions, TimerBoxOutline, j, k, l, m, TimerBoxFill, f, g, h, i, n, Reset, TryAnother, Start, Welcome1, Welcome2, Score, TopScore, Instructions2, CurrentScoreDisplay, TopScoreDisplay, UserInput, AnswerBox, UserInputNum, NewQuestion, CorrectAns, FbWrong, OperatorSign, OperatorSignNum, AdditionAns, SubtractionAns, YourScore, Congrats, Num1Display, Num2Display, SmallerNum, Instructions3, enabling interactive practice and timing features. Suitable for middle school mathematics teaching, focusing on practical application and comprehension of fraction addition.
GeoGebra Commands & Parameters
Polygon((11, 0), (13, 0), (13, 4), (11, 4)) → TimerBoxOutline, j, k, l, mPolygon((11, 0), (13, 0), (13, (4 * (100 - Timer) / 100)), (11, (4 * (100 - Timer) / 100))) → TimerBoxFill, f, g, h, iSegment((10, 4), (10, -2)) → nTextfield(UserInput) → AnswerBoxRandom(0, 1) → OperatorSignNumRandom(0, 1) → SmallerNumRandom(2, 12) → Den1Random(2, 12) → Den2Random(1, Den1 - 1) → Num1Random(1, Den2 - 1) → Num2
AI Drawing Prompt Reference
Create a dynamic visualization for adding fractions with different denominators, featuring two polygons of varying sizes, one of which gradually fills to represent a fraction. Display two fractions with randomly generated numerators and denominators, and use a symbol to indicate addition. Include a vertical segment on the left and a text input box at the bottom for users to enter their answers.
The prompt above was compiled from the original drawing commands and is for reference only.