
Absolute Value Inequality Demonstrations
Loading the math board and drawing, please wait…
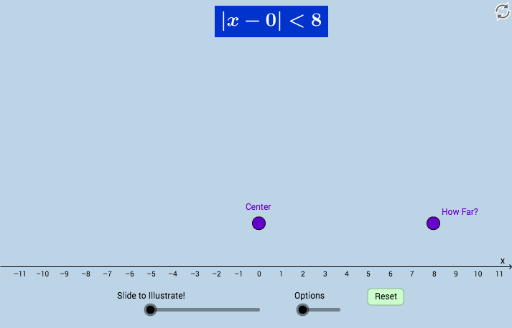
This example demonstrates absolute value inequalities dynamically. Key mathematical concepts include absolute values and inequalities. Using GeoGebra commands such as Ray, Point, Distance, etc., the solution set of the inequality can be dynamically shown. Suitable for high school mathematics education and learning.
GeoGebra Commands & Parameters
Ray(A, B) → fRay(A, C) → gPoint(f) → EMirror(E, A) → E'Vector(A, E) → uVector(A, E') → vDistance(A, E) → distanceAEDistance(A, E') → distanceAE'Ray(F, H) → hRay(D, G) → lSegment(D, F) → mCircle(A, 1) → cCircle(E', 1) → dCircle(E, 1) → eCircle(D, 4) → c_1Circle(F, 4) → d_1Intersect(c_1, t, 1) → LIntersect(d_1, t, 1) → MSegment(D, L) → f_1Segment(F, M) → g_1Polygon(O, N, 4) → poly1, h_1, i_1, j_1, k_1, R, SPolygon(Q, P, 4) → poly2, l_1, m_1, n_1, p_1, T, UDistance(S, R) → distanceSRDistance(U, T) → distanceUTDilate(A, If[0 < b ≤ 1, 1 - b, 0], E) → A'Segment(A, A') → q_1Dilate(A, If[0 < b ≤ 1, 1 - b, 0], E') → A'_1Segment(A, A'_1) → r_1Dilate(F, If[1 < b ≤ 2, 2 - b, 0], M) → F'Dilate(D, If[1 < b ≤ 2, 2 - b, 0], L) → D'Segment(F, F') → pSegment(D, D') → qTranslate(poly1, (-1.5, 0)) → poly1'Translate(poly2, (1.5, 0)) → poly2'Distance(U, T) → e_1Distance(S, R) → o_1
AI Drawing Prompt Reference
Draw a dynamic graph of absolute value inequalities. First, draw two rays f and g, then take point E on ray f and reflect it to E' with respect to point A. Draw vectors u and v, and calculate the distances of AE and AE'. Next, draw rays h and l, and line segment m, then draw circles c, d, and e with radius 1, and circles c_1 and d_1 with radius 4. Find the intersection points L and M of circles c_1 and d_1 with line t, draw line segments f_1 and g_1, then draw polygons poly1 and poly2, and their translations poly1' and poly2', and finally draw line segments q_1, r_1, p, and q, and adjust the size and position of the polygons.
The prompt above was compiled from the original drawing commands and is for reference only.