
Absolute Min and Max of a Function
Loading the math board and drawing, please wait…
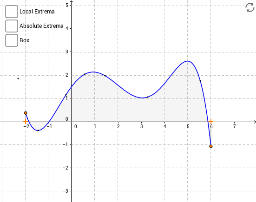
This example shows a function curve on a closed interval and allows users to modify the function with control points. Users can also adjust the interval. By observing local maxima and minima, the application of derivatives in finding extrema can be understood. The construction summary mentions the use of Point, Integral, UpperSum, LowerSum, If, Append, Zip, Sort commands. Suitable for high school math education and learning calculus concepts.
GeoGebra Commands & Parameters
Point(xAxis) → IPoint(xAxis) → HIntegral(f, xH, xI) → aUpperSum(f, xH, xI, 1) → cLowerSum(f, xH, xI, 1) → dIf(dx ≟ 0, f(xH), d / dx) → fminIf(dx ≟ 0, f(xH), c / dx) → fmaxAppend(L, Hend) → list1Append(list1, Iend) → list2Zip(y(p), p, list2) → ykeySort(list2, ykey) → list3If(dx ≟ 0, f(xH), Element[list3, Length[list3]]) → JIf(dx ≟ 0, f(xH), Element[list3, 1]) → K
AI Drawing Prompt Reference
Draw a function curve defined on a closed interval. Adjust the function by moving control points. Observe local maxima and minima to understand the application of derivatives in finding extrema. First, create two points I and H on the x-axis, then calculate the integral a, upper sum c, and lower sum d. Use derivatives to find the minimum value fmin and maximum value fmax. Finally, sort and find the extreme points J and K.
The prompt above was compiled from the original drawing commands and is for reference only.