
A Table of Powers for Exponential/Logarithmic and Calculus Connections
Loading the math board and drawing, please wait…
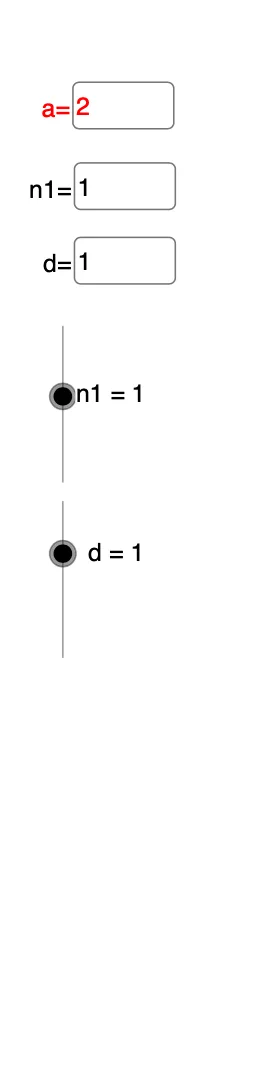
This GeoGebra example demonstrates a visual “table of powers,” presenting how power values change across different exponents and supporting intuitive exploration of related exponential, logarithmic, and calculus ideas. Key concepts include exponentiation (power functions), logarithmic function reformulation, and the way power expressions connect to calculus topics such as indefinite integrals. Construction-wise, the model relies on GeoGebra’s Textfield for labeling and reporting parameters and computed entries (notably objects such as d and n1, along with many labeled point/object groups like A1–A21 and C2–C17). By arranging these objects together with text annotations, the example turns algebraic power results into an organized, readable table-like visualization. Suitable for upper secondary students and early university learners as a classroom demo for spotting patterns in exponential behavior and building intuition for log/calculus relationships.
GeoGebra Commands & Parameters
Textfield(a) → InputBox1Textfield(n1) → InputBox2Textfield(d) → InputBox3
AI Drawing Prompt Reference
Create a visual table showing how power values change across different exponents to explore connections between exponential, logarithmic, and calculus concepts. Include input boxes for parameters, a slider to adjust the exponent range, and text annotations for key points and computed results, organizing algebraic outcomes into an easily readable table format suitable for classroom demonstrations.
The prompt above was compiled from the original drawing commands and is for reference only.