
68-95-99.7 Rule Practice
Loading the math board and drawing, please wait…
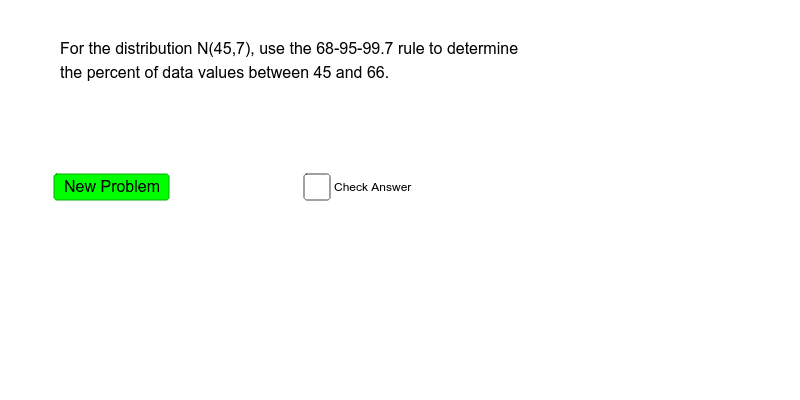
This example demonstrates the 68-95-99.7 rule, which describes the typical distribution of data: about 68% of data falls within one standard deviation of the mean, 95% within two standard deviations, and 99.7% within three standard deviations. Key mathematical concepts include standard deviation, probability distribution, and data visualization. Construction involves using GeoGebra commands such as Shuffle, Element, Random, Sequence, and Sum to generate random datasets and calculate standard deviations. Suitable for middle or high school students to understand statistical foundations and data analysis skills.
GeoGebra Commands & Parameters
Shuffle(mult) → list1Element(list1, 1) → aElement(list1, 2) → bRandom(10, 100) → mmRandom(2, 20) → ssSequence(Element[list2, 4 + i], i, Min[a, b], Max[a, b] - 1) → eSum(e) → ans
AI Drawing Prompt Reference
Create a statistical chart demonstrating the 68-95-99.7 rule by generating a random dataset, marking the mean and three standard deviation ranges, and using different colors or shading to represent the proportion of data within each range.
The prompt above was compiled from the original drawing commands and is for reference only.