
3-Way Color-Changing Derivative Grapher
Loading the math board and drawing, please wait…
In collections
Graphing derivatives
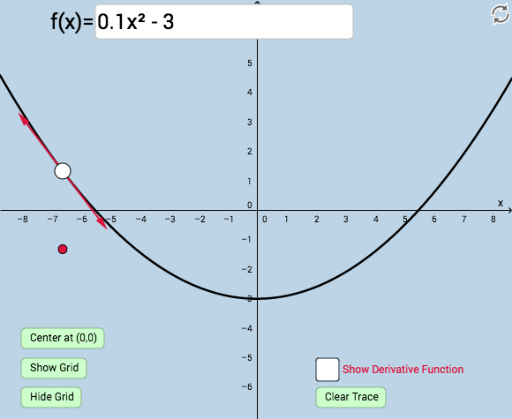
① This example dynamically demonstrates the geometric meaning of the derivative as an instantaneous rate of change by showing the function graph, its tangent line, and the slope in three distinct colors. ② Core mathematical concepts include derivatives, tangent line slope, function graphs, and linear functions, rooted in the fundamental definition and geometric interpretation of calculus. ③ Construction highlights: using GeoGebra commands such as Tangent, Slope, Textfield, Intersect, Circle, and Vector, along with objects a, f, A, g, m, InputBox1, InputBox2, button1, f', h, B, b, i, C, c, D, E, u, v, text1, d, button2, button3, button4, to build an interactive interface where users can input functions and observe tangent lines, slopes, and color changes. ④ Suitable for high school to university calculus courses, this tool helps students grasp the concept of derivatives, tangent slopes, and the relationship with function change rates, and also supports independent exploration of derivative behaviors for various functions.
GeoGebra Commands & Parameters
Tangent(A, f) → gSlope(g) → mTextfield(f) → InputBox1Textfield(a) → InputBox2Intersect(f', h, (-6.584198838559817, -1.3168397677119634)) → BIntersect(f', i, 1) → CCircle(A, 2.5) → cIntersect(c, g) → D, EVector(A, D) → uVector(A, E) → v