
2014 AP® Statistics Free-Response Example
Loading the math board and drawing, please wait…
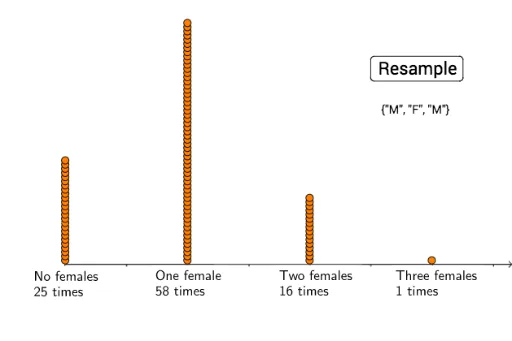
This example demonstrates an AP® Statistics free-response question focusing on data analysis and statistical visualization. Key math concepts include probability & statistics, data visualization, and sample handling. GeoGebra commands and objects used in the construction summary are Sample (sampling), CountIf (counting), Length (length), and DotPlot (histogram). Suitable for high school and above students for statistical learning and exam preparation.
GeoGebra Commands & Parameters
Sample(em, 3, false) → list1CountIf(x ≟ "F", list1) → aLength(data) → bDotPlot(data, false, 0.1) → list2CountIf(x ≟ "F", list1) → cCountIf(x ≟ 1, data) → dCountIf(x ≟ 0, data) → eCountIf(x ≟ 2, data) → fCountIf(x ≟ 3, data) → g