
相关性类型
几何画板及绘图内容加载中,请稍等……
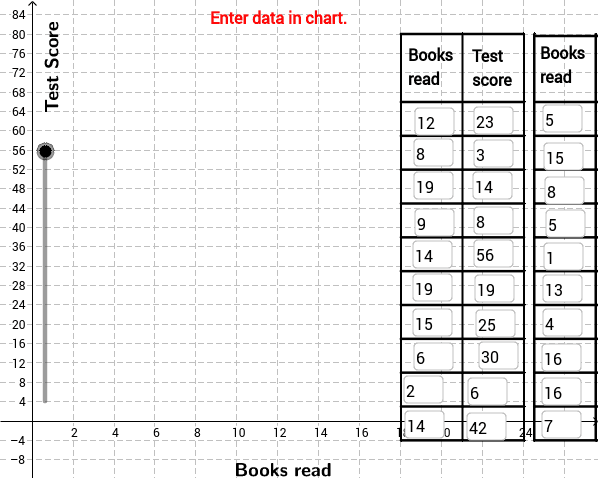
本示例展示了如何使用相关系数来描述数据点之间的线性关系强弱。涉及的概念包括皮尔逊相关系数 (PMCC)、回归直线拟合、散点图分析以及相关性类型的判断。通过 GeoGebra 命令 FitLineY 计算回归直线,PMCC 计算相关系数,并利用 Textfield、If、Polygon、RotateText、Segment、Sequence 等命令动态显示结果与图形。适合高中或大学一年级统计学与数据分析课程,以及数学爱好者的互动学习。
GeoGebra 命令及参数
FitLineY(PointList1) → LineFitPMCC(PointList1) → CorCoeffTextfield(A2) → InA2Textfield(A3) → InA3Textfield(A4) → InA4Textfield(A5) → InA5Textfield(A6) → InA6Textfield(A7) → InA7Textfield(A8) → InA8Textfield(A9) → InA9Textfield(A10) → InA10Textfield(A11) → InA11Textfield(A12) → InA12Textfield(A13) → InA13Textfield(A14) → InA14Textfield(A15) → InA15Textfield(A16) → InA16Textfield(A17) → InA17Textfield(A18) → InA18Textfield(A19) → InA19Textfield(A20) → InA20Textfield(A21) → InA21Textfield(B2) → InB2Textfield(B3) → InB3Textfield(B4) → InB4Textfield(B5) → InB5Textfield(B6) → InB6Textfield(B7) → InB7Textfield(B8) → InB8Textfield(B9) → InB9Textfield(B10) → InB10Textfield(B11) → InB11Textfield(B12) → InB12Textfield(B13) → InB13Textfield(B14) → InB14Textfield(B15) → InB15Textfield(B16) → InB16Textfield(B17) → InB17Textfield(B18) → InB18Textfield(B19) → InB19Textfield(B20) → InB20Textfield(B21) → InB21If(LineVisible, "Hide Best Fit Line", "Show Best Fit Line") → LineButtonPolygon((21, y(Corner[1])), Corner[2], Corner[3], (21, y(Corner[4]))) → poly1, a, b, c, dRotateText("Test Score", 90*°) → SideLegendRotateText("Books read", 0) → BottomLegendIf(CorVisible, "Hide Correlation Coefficient", "Show Correlation Coefficient") → CorButtonSegment((17.99999951219512, 80.06896551724147), (23.95121951219512, 80.06896551724147)) → top1Segment((24.536580487804876, 79.65516896551733), (30.536580487804876, 79.65516896551733)) → top2Sequence(Segment[(18 + 3 * i, -4), (18 + 3 * i, 80)], i, 0, 2) → Linesv1Sequence(Segment[(24.5 + 3 * i, -4), (24.5 + 3 * i, 80)], i, 0, 2) → Linesv2Sequence(Segment[(24.5, 0 - 4 + 7 * i), (30.5, -4 + 7 * i)], i, 0, 10) → Linesh2Sequence(Segment[(18, 0 - 4 + 7 * i), (24, -4 + 7 * i)], i, 0, 10) → Linesh1