
散点图绘制教程:随机坐标点生成与可视化
几何画板及绘图内容加载中,请稍等……
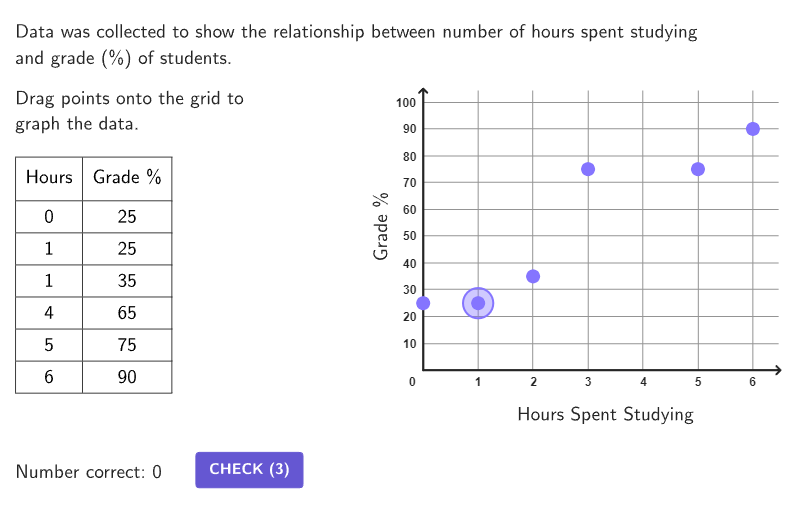
本范例演示如何在GeoGebra中创建散点图并可视化随机生成的坐标点数据。核心数学概念包括坐标平面、随机数生成、点列操作与数据统计可视化。作图要点:使用Random命令族生成随机坐标点数据,通过Sequence和Zip批量创建点对象,借助Flatten整理数据格式,用Sort和Unique实现数据去重与排序,结合Polygon和Segment绘制数据特征线,可通过Slider添加交互式动画效果。本范例适合中学数学的统计与概率教学、大学预科数据分析入门,以及GeoGebra命令学习的实践案例。
GeoGebra 命令及参数
Flatten(Sequence[Sequence[1, 3], n, 1, 33]) → randomProbsElement(randomProbs, Mod[countQuestion, 99] + 1) → randomProbPixelsToPoint(Corner[1], Corner[3], Corner[5], (11 + 5, 154)) → CornerLeftTableShuffle(Sequence[Random[-100, 100] / 10, i, 1, 102]) → randomMult, {-2.3, -2.3, -4.8, 6.5, 5.9, 2.9, -7.7, -3.5, 5.7, 2.9, 2.2, -0.3, 7.7, 0.5, -1.7, -1.3, -9.9, -5.3, -5.2, -9.2, 7.3, 4.3, 0.7, 6.1, 4.5, -0.4, -9.7, 9.3, 2.8, 4.7, -9.3, -8.6, -8, -2.1, -1.5, 6.1, 4.6, 4, -2.2, -2.9, 9.5, 8.4, -1, 3.8, -4.2, -5.7, 6.9, -8.4, -7.9, 5.2, 2.3, -5.2, -6.9, -5, -2, 0.9, -3.8, -6.7, 8.5, 6.4, 0, -4.2, -5.7, 8, 2.5, 1.6, 5.9, -3.1, 3.1, 9.5, -4.5, -7.7, -0.7, 6, 4.9, -5.4, -3.7, 6.9, -0.6, 7.4, -3.3, -9, 5.5, -1, -0.6, -1.9, -0.3, 2.7, -7.1, -0.2, 8.5, 10, 9.4, -6.1, 1.8, 5, 4, 1.2, 9.1, -8.5, -6.9, -1.8}Shuffle(Sequence[Random[10, 20], i, 1, 102]) → randomRecip, {19, 13, 19, 13, 17, 10, 18, 18, 10, 17, 20, 15, 18, 11, 19, 17, 19, 14, 13, 19, 20, 14, 17, 15, 17, 18, 14, 12, 17, 14, 18, 15, 20, 12, 10, 15, 14, 20, 11, 14, 12, 15, 12, 14, 11, 13, 16, 13, 10, 17, 14, 18, 13, 16, 13, 19, 19, 12, 19, 20, 13, 17, 14, 12, 10, 17, 16, 14, 13, 13, 17, 13, 16, 15, 18, 18, 15, 10, 13, 12, 12, 11, 13, 11, 19, 19, 16, 11, 14, 17, 18, 20, 13, 16, 15, 15, 17, 14, 11, 18, 15, 17}Shuffle(Sequence[Random[0, 60] / 10, i, 1, 102]) → randomXH, {3.8, 1.2, 0.5, 4.5, 5.7, 0.4, 1.5, 6, 0.6, 3, 0.5, 4, 1.3, 2.8, 5.7, 2.3, 3.9, 3.1, 0.8, 5.3, 5.9, 0, 1, 1.2, 1.9, 0.8, 4.3, 3.3, 4.4, 5.3, 2.4, 2.3, 2.2, 0.7, 4.9, 1.2, 4.9, 0.6, 1.5, 0, 2.8, 4.4, 0.2, 5, 3.3, 2.9, 1.1, 0.8, 2.1, 5.3, 5.4, 2.1, 0.2, 2.2, 5.4, 3.5, 1.9, 2.2, 4.8, 5.3, 0.8, 0.6, 2, 0.3, 5.6, 0, 0.3, 0.9, 2.3, 3.3, 3.7, 5.9, 2.4, 4.2, 4.1, 4.3, 0.4, 1.1, 0.6, 2.3, 3.3, 5.4, 1, 1, 4.4, 2.2, 1.3, 0.7, 0.7, 1.5, 5.9, 4.9, 4.9, 4, 5, 4.1, 3.6, 0.5, 6, 0.1, 0.2, 4.4}Shuffle(Sequence[Random[100, 138] / 10, n, 1, 100]) → randomSlopes1, {12.5, 12.6, 12.9, 13.7, 10.2, 13.6, 11.2, 11.3, 12.5, 10.9, 12.7, 12.2, 12.2, 13.3, 11.7, 10.4, 13, 10.7, 10.3, 12.2, 12.5, 12.7, 13, 12.4, 12.4, 10, 11.5, 11.9, 10.7, 10.5, 10, 12.9, 12.5, 12.6, 12.1, 11.1, 13.1, 10.8, 12.7, 10.3, 10.4, 11.7, 13, 13.4, 13.2, 11.6, 13.6, 13.2, 11.2, 10.3, 10.4, 13.2, 11.7, 12.2, 10.2, 13.8, 12.8, 12, 13.3, 10, 13.3, 11.9, 11.3, 11.6, 12.3, 11.7, 11.8, 11.4, 11.8, 13.5, 12.7, 12.4, 10.7, 12.6, 13.1, 13, 11, 12.8, 10.6, 12, 12.8, 11.4, 12.9, 11, 11.6, 11.9, 12.2, 13.2, 13.5, 12.6, 13.7, 13.1, 12.4, 12.4, 12.7, 10.4, 11.7, 10.3, 11.8, 12.6}Element(randomSlopes1, Mod[countQuestion, 100] + 1) → randomSlope1Shuffle(Sequence[Random[-32, -20] / 10, n, 1, 100]) → randomSlopes2, {-2.9, -2.2, -2.7, -2.8, -2.8, -2.9, -2.7, -2.9, -3.2, -2.2, -2.7, -2.4, -2.8, -2, -3, -2.3, -2.8, -3.1, -2, -2.1, -2.9, -2.7, -2.2, -2.4, -2.7, -2.8, -2.5, -2.4, -2.4, -2.1, -2, -2.2, -2.9, -2.3, -2.9, -2.7, -2.9, -2.6, -2.9, -2.6, -2, -2.8, -2, -2.9, -3.1, -2.5, -2.8, -3, -2, -2.8, -3, -2.2, -3, -2, -2.4, -2.9, -2.4, -2.4, -2.2, -2.2, -2.5, -2, -2.6, -3.2, -2.3, -2.7, -2.2, -3.2, -3.1, -2.8, -3.1, -2, -2.3, -2.5, -2.9, -2, -2.7, -2.1, -2.4, -3, -2.2, -2, -2.4, -2.7, -2.2, -2.3, -2.1, -2.9, -2.4, -3.1, -2.4, -2.9, -2.3, -3.2, -2.4, -2.1, -3, -2.3, -2.6, -2.7}Element(randomSlopes2, Mod[countQuestion, 100] + 1) → randomSlope2Shuffle(Sequence[Random[1, 6], n, 1, 102]) → problem3x, {6, 5, 3, 5, 3, 4, 4, 2, 5, 2, 6, 1, 2, 1, 4, 1, 6, 4, 1, 5, 2, 5, 6, 5, 2, 4, 6, 6, 3, 3, 4, 3, 6, 5, 5, 5, 3, 6, 6, 5, 6, 4, 6, 5, 4, 1, 1, 2, 4, 2, 6, 1, 3, 4, 6, 1, 4, 4, 5, 4, 5, 3, 4, 4, 4, 1, 5, 3, 4, 5, 2, 2, 5, 2, 4, 3, 2, 2, 6, 5, 5, 5, 5, 2, 1, 1, 5, 5, 3, 6, 6, 2, 3, 1, 5, 6, 1, 4, 1, 1, 5, 5}Shuffle(Sequence[(round(Random[20, 100] / 5) * 5), n, 1, 102]) → problem3y, {60, 25, 40, 85, 70, 40, 45, 35, 65, 20, 20, 80, 75, 55, 85, 65, 60, 100, 25, 45, 85, 60, 95, 85, 65, 95, 45, 45, 60, 95, 40, 40, 65, 95, 55, 45, 90, 80, 20, 65, 65, 90, 75, 80, 100, 40, 80, 90, 50, 45, 65, 65, 100, 55, 70, 40, 50, 60, 35, 30, 40, 75, 35, 90, 30, 35, 25, 85, 25, 40, 65, 75, 40, 80, 40, 50, 30, 85, 25, 75, 100, 50, 90, 45, 55, 25, 35, 25, 70, 85, 35, 20, 30, 80, 35, 65, 95, 25, 25, 70, 40, 60}Unique(randomPoints3) → randomPoints3ULength(randomPoints3U) → lengthUnique3If(6 < Mod[(6 * (countQuestion + 1)), lengthUnique3] < lengthUnique3, Take[randomPoints3U, Mod[(6 * countQuestion), lengthUnique3] + 1, Mod[(6 * (countQuestion + 1)), lengthUnique3]], Mod[(6 * (countQuestion + 1)), lengthUnique3] ≟ 0, Last[randomPoints3U, 6], Join[{Last[randomPoints3U, 6 - Mod[(6 * (countQuestion + 1)), lengthUnique3]], First[randomPoints3U, Mod[(6 * (countQuestion + 1)), lengthUnique3]]}]) → uniqueRandomPoints3If(randomProb ≠ 2, ((42 + 2) * pixelHeightConvert), ((55 + 2) * pixelHeightConvert)) → titleHeightIf(randomProb ≟ 2, 20, 100) → numMaxIf(randomProb ≟ 1, randomSlope1, randomProb ≟ 2, randomSlope2, 0) → randomSlopeZip((n, guideLine(n) + c / k), n, randomXH, c, randomMult, k, randomRecip) → problemPoints12Zip((round(x(n)), (round((y(n) * If[randomProb ≟ 2, 1, 0.2])) * If[randomProb ≟ 2, 1, 5])), n, problemPoints12) → problemPoints12RoundedUnique(KeepIf[y(n) < numMax, n, problemPoints12Rounded]) → problemPoints12ULength(problemPoints12U) → lengthUnique12If(6 < Mod[(6 * (countQuestion + 1)), lengthUnique12] < lengthUnique12, Take[problemPoints12U, Mod[(6 * countQuestion), lengthUnique12] + 1, Mod[(6 * (countQuestion + 1)), lengthUnique12]], Mod[(6 * (countQuestion + 1)), lengthUnique12] ≟ 0, Last[problemPoints12U, 6], Join[{Last[problemPoints12U, 6 - Mod[(6 * (countQuestion + 1)), lengthUnique12]], First[problemPoints12U, Mod[(6 * (countQuestion + 1)), lengthUnique12]]}]) → uniqueRandomPoints12If(randomProb ≟ 3, uniqueRandomPoints3, uniqueRandomPoints12) → randomPointsSort(Zip[(round(x(n)), If[y(n) < 0, 0, y(n)]), n, randomPoints]) → randomPointsRoundedIf(randomProb ≟ 2, 0.2, 1) → scalingFactorFlatten(Sequence[Sequence[(n / 2, ((5 * m) * scalingFactor)), n, -6, 12], m, 0, 20]) → DragPointsPoint(DragPoints) → InputPoint1Point(DragPoints) → InputPoint6Point(DragPoints) → InputPoint5Point(DragPoints) → InputPoint4Point(DragPoints) → InputPoint3Point(DragPoints) → InputPoint2Zip((x(n), y(n)), n, answerInput1) → answerInputKeepIf(¬(n ∈ answerInput), n, randomPointsRounded) → errorListPolygon({(-2.5, (105 * scalingFactor)), (-2.5, (-1 * scalingFactor)), (6.5, (-1 * scalingFactor)), (6.5, (105 * scalingFactor))}) → DragAreaSort(answerInput) → answerInputSortedZip(n ∈ randomPointsRounded, n, answerInput) → boolCorrectsZip(abs(y(m) - y(n)), m, answerInputSorted, n, randomPointsRounded) → solutionYDifferencesZip(abs(x(m) - x(n)), m, answerInputSorted, n, randomPointsRounded) → solutionXDifferencesZip(n ≟ 0 ∧ m ≤ (2 * scalingFactor), n, solutionXDifferences, m, solutionYDifferences) → boolCorrectPointsPolygon(graphDimPoints) → graphAreaShuffle(Sequence[Random[20, 100], n, 1, 100]) → randomList2, {63, 23, 32, 22, 54, 56, 94, 40, 28, 86, 28, 36, 100, 30, 71, 21, 72, 47, 52, 75, 49, 65, 75, 35, 88, 74, 82, 32, 53, 38, 30, 98, 38, 100, 39, 72, 85, 95, 94, 73, 84, 23, 62, 34, 23, 30, 80, 68, 41, 92, 60, 71, 25, 92, 71, 61, 99, 79, 87, 98, 55, 64, 64, 33, 85, 96, 20, 63, 64, 79, 23, 61, 41, 96, 76, 24, 41, 60, 96, 41, 84, 52, 95, 57, 69, 87, 50, 34, 99, 44, 22, 30, 78, 62, 47, 86, 67, 20, 26, 66}Element(randomList2, Mod[countQuestion, 15] + 1) → randomNum2Shuffle(Sequence[Random[1, 6], n, 1, 100]) → randomList1, {5, 2, 5, 5, 5, 4, 6, 5, 6, 6, 3, 2, 5, 6, 5, 5, 3, 6, 5, 2, 5, 3, 6, 1, 5, 6, 4, 3, 2, 5, 2, 1, 2, 4, 3, 4, 2, 5, 3, 2, 3, 4, 4, 3, 4, 3, 2, 5, 1, 5, 5, 5, 3, 1, 3, 2, 2, 4, 2, 5, 1, 3, 3, 4, 3, 6, 2, 3, 1, 2, 1, 4, 5, 5, 2, 1, 6, 5, 1, 4, 5, 1, 2, 6, 2, 4, 4, 4, 2, 3, 2, 3, 2, 1, 2, 5, 3, 4, 2, 1}Element(randomList1, Mod[countQuestion, 20] + 1) → randomNum1Polygon(Zip[PixelsToPoint[Corner[1], Corner[3], Corner[5], A], A, {(pixelsLeft, pixelsTop), (pixelsLeft, y(Corner[5]) - pixelsBottom), Corner[5] - (pixelsRight, pixelsBottom), (x(Corner[5]) - pixelsRight, pixelsTop)}]) → borderBoxCorner(5) → layoutAppSizeFlatten(Sequence[6 / Random[20, 100], n, 1, 100]) → scatterLinesShuffle(Sequence[Random[20, 30], n, 1, 100]) → randomInts, {22, 23, 29, 27, 24, 26, 29, 23, 29, 22, 30, 22, 25, 23, 22, 21, 24, 23, 28, 25, 20, 22, 23, 20, 21, 24, 21, 25, 21, 20, 22, 26, 29, 20, 26, 20, 21, 25, 27, 25, 23, 22, 25, 30, 30, 28, 23, 22, 23, 24, 20, 23, 26, 29, 22, 22, 21, 29, 23, 29, 26, 22, 20, 25, 22, 20, 25, 28, 20, 26, 24, 22, 23, 23, 30, 27, 22, 21, 27, 22, 29, 30, 30, 27, 22, 30, 23, 26, 20, 21, 29, 20, 22, 20, 26, 21, 23, 20, 20, 23}Segment((0, 0), (graphDims(3), 0)) → axisXSegment((0, 0), (0, graphDims(4))) → axisYShuffle(Sequence[Random[1, 2], n, 1, 100]) → randomOrders, {1, 2, 1, 1, 1, 2, 2, 2, 2, 2, 2, 1, 1, 1, 2, 1, 1, 1, 1, 1, 1, 2, 1, 1, 2, 2, 1, 2, 2, 2, 1, 1, 2, 2, 2, 2, 2, 2, 2, 1, 1, 1, 2, 2, 1, 2, 2, 2, 1, 1, 1, 2, 2, 1, 2, 1, 2, 1, 1, 1, 2, 2, 2, 2, 1, 2, 1, 2, 2, 2, 1, 1, 2, 1, 2, 1, 2, 1, 2, 2, 2, 1, 1, 2, 1, 1, 1, 1, 1, 1, 2, 1, 2, 1, 2, 2, 2, 2, 1, 2}Element(randomOrders, Mod[countQuestion, 100] + 1) → randomOrderDistance(Corner[sizeLabelX, 1], Corner[sizeLabelX, 2]) → numLabelXWDistance(Corner[sizeLabelY, 1], Corner[sizeLabelY, 2]) → numLabelYWJoin({{tableLabel(1) + "&" + (tableLabel(2)) + "\vphantom{\frac{a}{b}}\\\hline"}, Sequence["" + (x(randomPointsRounded(n))) + "&" + (y(randomPointsRounded(n))) + "\vphantom{\large{|}}\\\hline", n, 1, 6]}) → textListForTableSum(textListForTable) → textForTablePolygon(Sequence[Corner[textLabelX, n], n, 1, 4]) → boxAxisXLabelPolygon(Sequence[Corner[textLabelY, n], n, 1, 4]) → boxAxisYLabelPolygon(polygonCoords) → dragAreaCorner(sizingText, 4) → CornerSizingSequence(Corner[textLabelX, n], n, 1, 4) → xLabelCornersSequence(Corner[textLabelY, n], n, 1, 4) → yLabelCornersVerticalText(textLabelY) → vertLabelYVerticalText(textLabelY) → sizeLabelYVertDistance(Corner[sizeLabelYVert, 1], Corner[sizeLabelYVert, 4]) → numVertYHTranslate(PolygonCoordsStart, Vector[(2 * Vector[CornerSizing, PolygonCoordsStart])]) → StartInputPointRemoveUndefined(Sequence[If[boolCorrectPoints(n), answerInputSorted(n)], n, 1, 6]) → correctPointsmakeBox(CornerLeftTable, rowWidth, boxHeight) → hintBoxIf(animationSlider < 0.3, 0, animationSlider - 0.3) → animationSlider1PartitionPoint(HintPoint1, HintPoint3, animationSlider1, 1) → HintAnimate1PartitionPoint(HintPoint2, HintPoint3, animationSlider1, 1) → HintAnimate2Segment(HintPoint2, HintAnimate2 - (0.15, 0)) → hintSeg2Segment(HintPoint1, HintAnimate1 - (0, (2.4 * scalingFactor))) → hintSeg1Translate(hintBox, Vector[(0, ((-numFirstIncorrect) * rowHeight) - titleHeight)]) → hintBoxFirstTranslate(hintBox, Vector[(0, ((-numFirstIncorrect) * rowHeight) - titleHeight)]) → hintBoxOutlineRemove(answerInput, randomPointsRounded) → errorListInputIntersection(answerInput, randomPointsRounded) → solutionListZip(PartitionPoint[n, m, animationSlider2, 1], n, Sort[errorListInput], m, Sort[errorList]) → solutionAnimationSum({tableLabel(1) + "&" + (tableLabel(2)) + "\vphantom{\frac{a}{b}}\\\hline"}) → textForTitleSum({"" + (x(randomPointsRounded(1))) + "&" + (y(randomPointsRounded(1))) + "\vphantom{\large{|}}\\\hline"}) → textForRowexpandCircle(InputPoint1, 7 + (7 * pulsing), Corner[1], Corner[3], Corner[5]) → pulsingObject
AI 绘图提示语参考
该图形由一组随机生成的散点构成,点的坐标通过随机数生成并去重后排序。散点分布在坐标平面上,部分点可能被标记为特殊点。图形中包含一个矩形区域,用于表示可拖动的数据范围,以及一个边框框住整个散点区域。整体设计用于统计与概率教学,展示随机点分布和数据可视化效果。
以上提示语为根据原始绘图命令整理而来,仅供参考。