
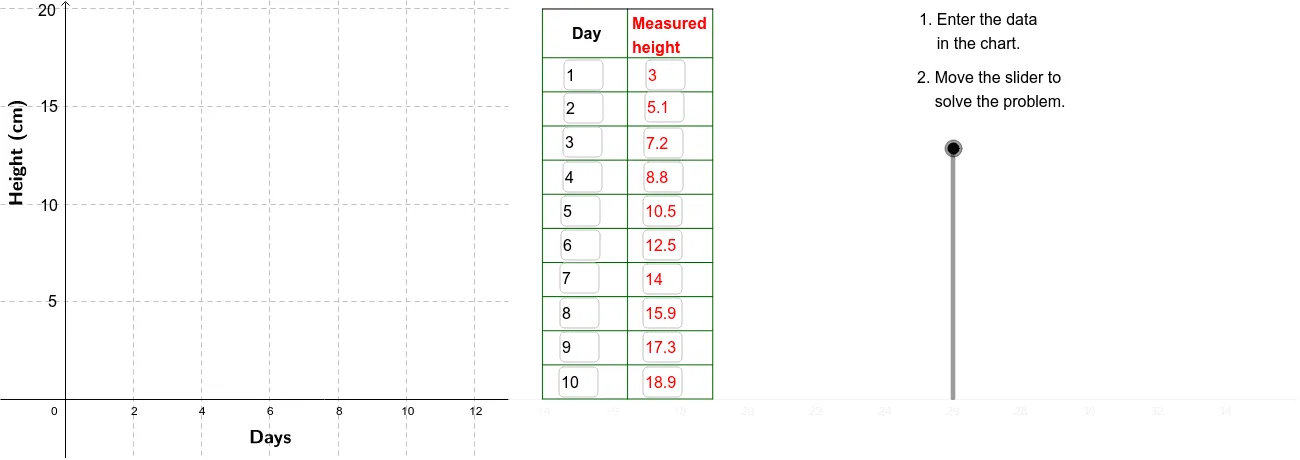
植物生长高度随日期变化的线性函数图示例
几何画板及绘图内容加载中,请稍等……
① 演示植物在10天内每日高度记录形成的线性增长趋势图。② 涉及的核心数学概念:线性函数、数列、坐标几何、函数图像绘制。③ 作图要点——从构造摘要提炼用到的 GeoGebra 命令/对象:使用 Sequence 生成日期序列,Textfield 显示数据,Segment 连接相邻数据点形成折线,Polygon 与 VerticalText 辅助标注,对象包括 A1‑A11、B1‑B11、C1‑C11、D1‑D7 等点集。④ 适合的学段或用途:适用于初中代数与函数教学、高中数列与坐标几何复习,也可作为数据可视化入门素材。
GeoGebra 命令及参数
Sequence(Segment[(11.5, (5 * i)), (12.5, (5 * i))], i, 1, 4) → TickListTextfield(A2) → InA2Textfield(A3) → InA3Textfield(A4) → InA4Textfield(A5) → InA5Textfield(A6) → InA6Textfield(A7) → InA7Textfield(A8) → InA8Textfield(A9) → InA9Textfield(A10) → InA10Textfield(A11) → InA11Textfield(B2) → InB2Textfield(B3) → InB3Textfield(B4) → InB4Textfield(B5) → InB5Textfield(B6) → InB6Textfield(B7) → InB7Textfield(B8) → InB8Textfield(B9) → InB9Textfield(B10) → InB10Textfield(B11) → InB11Sequence(Segment[(14, 0 + (1.75 * i)), (19, 0 + (1.75 * i))], i, 0, 10) → CrossList1Sequence(Segment[(19, 0 + (1.75 * i)), (21.5, 0 + (1.75 * i))], i, 0, 10) → CrossList2Sequence(Segment[(21.5, 0 + (1.75 * i)), (24, 0 + (1.75 * i))], i, 0, 10) → CrossList3Sequence(Segment[(14 + (2.5 * i), 0), (14 + (2.5 * i), 20)], i, 0, 2) → SideList1Segment((14, 20), (19, 20)) → Top1Segment((19, 20), (21.5, 20)) → Top2Segment((21.5, 20), (24, 20)) → Top3Segment((21.5, 0), (21.5, 20)) → Side2Segment((24, 0), (24, 20)) → Side3Polygon((13, y(Corner[1])), Corner[2], Corner[3], (13, y(Corner[4]))) → poly1, b, c, d, eSegment((0, 10), (13, 10)) → ResidualAxisVerticalText("Height (cm)") → HeightSegment((-2, 0), (13.08807, 0)) → CoverAxis