
分段函数与单位圆示例
几何画板及绘图内容加载中,请稍等……
该示例展示了分段函数与单位圆的图形关系。涉及的核心数学概念包括分段函数、单位圆和连续性。通过使用Polygon、Point、Segment、Vector等GeoGebra命令,可以构造出分段函数的图像和单位圆的动态演示。适合高中数学教学和学习。
GeoGebra 命令及参数
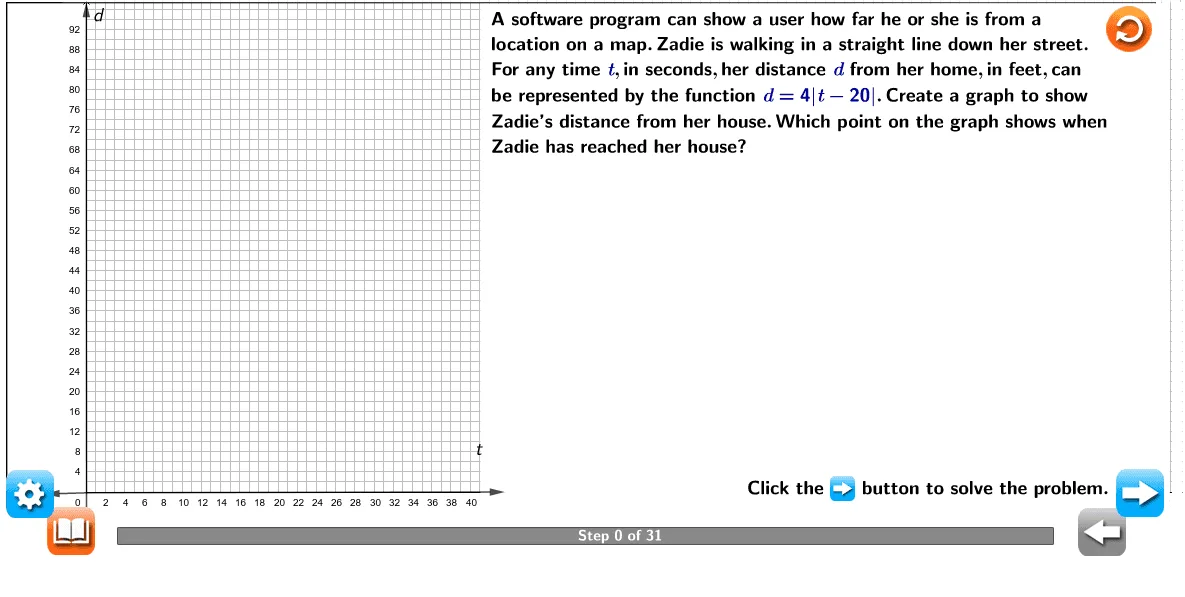
Polygon(A, B, C, D, E, F, G) → poly1, a_1, b_1, c, d, e, f, gPolygon(H, I, J, K) → q1, h, i, j, kPoint(k) → MSegment(L, M) → lVector(N, O) → uVector(N, R) → vPoint(xAxis) → SVector(N, S) → wVector(N, T) → mLaTeX("\text{Determine a domain for the problem statement.}") → text1_2LaTeX("\text{Determine the range for the given domain.}") → text1_4LaTeX("\text{Find the vertex of the graph of the absolute value function.}") → text1_5LaTeX("\text{Determine whether the vertex is a minimum or a maximum.}") → text1_{11}LaTeX("\text{Original function}") → text1_{18}LaTeX("\text{Original function}") → text1_{25}LaTeX("\text{Use the three points to create the graph of the function on the determined\\domain.}") → text1_{33}LaTeX("\text{Interpret the graph to find when Zadie will arrive at her house.}") → text1_{36}LaTeX((("\text{Step {" * Slider) * "} of 31}")) → text1_{37}LaTeX("\text{Click the button to solve the problem.}") → text2LaTeX("\text{Since the input,\textcolor{#000099}{\mathit{t}},is time,\textcolor{#000099}{\mathit{t}} can be greater than or equal to \textcolor{#000099}{0}.The domain is\\\textcolor{#000099}{\mathit{t} ≥ 0}.}") → text1_1LaTeX("\text{For the function \textcolor{#000099}{\mathit{d} = 4|\mathit{t} −20|,\mathit{a} > 0},and \textcolor{#000099}{\mathit{k} = 0}.The minimum of\\the range is \textcolor{#000099}{\mathit{d} = 0}.The range of the function is \textcolor{#000099}{\mathit{d} ≥ 0}.}") → text1_6LaTeX("\text{The coordinates of the vertex of the graph of an absolute value function are\\the values of \textcolor{#000099}{\mathit{h}} and \textcolor{#000099}{\mathit{k}} when the function is in standard form,\textcolor{#000099}{\mathit{y} = \mathit{a}|\mathit{x} − \mathit{h}| + \mathit{k}}.}") → text1_8LaTeX((("\text{Therefore,the coordinates of the vertex are \textcolor{#000099}{({" * b) * "}, 0)}.}")) → text1_7LaTeX((("\text{Thus,the vertex,\textcolor{#000099}{({" * b) * "}, 0)},is a minimum of the function.}")) → text1_{10}LaTeX("\text{Find at least two additional points on the graph.One should have an input\\less than the \textcolor{#000099}{\mathit{t}}-coordinate of the vertex,and the other should have an\\input greater than the \textcolor{#000099}{\mathit{t}}-coordinate of the vertex.}") → text1_9LaTeX((((("\text{\textcolor{#000099}{\mathit{d} = {" * a) * "}|\mathit{t} −{") * b) * "}|}}")) → text1_{14}LaTeX((((("\text{\textcolor{#000099}{\mathit{d} = {" * a) * "}|0 −{") * b) * "}|}}")) → text1_{16}LaTeX((((("\text{\textcolor{#000099}{\mathit{d} = {" * a) * "}|−{") * b) * "}|}}")) → text1_{15}LaTeX((((("\text{\textcolor{#000099}{\mathit{d} = {" * a) * "}({") * b) * "})}}")) → text1_{22}LaTeX((("\text{\textcolor{#000099}{\mathit{d} ={" * sum) * "}}}")) → text1_{21}LaTeX((("\text{The point at the minimum of the domain is \textcolor{#000099}{(0, {" * sum) * "})}.}")) → text1_{19}LaTeX((("\text{Evaluate the function at a value of \textcolor{#000099}{\mathit{t}} greater than \textcolor{#000099}{{" * b) * "}}.")) → text1_{24}LaTeX("\text{Let \textcolor{#000099}{\mathit{t} = 30}.}") → text1_{23}LaTeX((((("\text{\textcolor{#000099}{\mathit{d} = {" * a) * "}|\mathit{t} −{") * b) * "}|}}")) → text1_{26}LaTeX((((("\text{\textcolor{#000099}{\mathit{d} = {" * a) * "}|30−{") * b) * "}|}}")) → text1_{28}LaTeX((((("\text{\textcolor{#000099}{\mathit{d} = {" * a) * "}|{") * min) * "}|}}")) → text1_{27}LaTeX((((("\text{\textcolor{#000099}{\mathit{d} = {" * a) * "}({") * min) * "})}}")) → text1_{32}LaTeX((("\text{\textcolor{#000099}{d = {" * mul) * "}}")) → text1_{31}LaTeX((((("\text{A point with an input greater than \textcolor{#000099}{{" * b) * "}} is \textcolor{#000099}{(30, {") * mul) * "})}.}")) → text1_{34}LaTeX((((((("\text{Plot \textcolor{#000099}{(0, {" * sum) * "}), ({") * b) * "}, 0)},and \textcolor{#000099}{(30, {") * mul) * "})} on the domain \textcolor{#000099}{\mathit{t} ≥ 0}.An absolute value\\graph will have two rays with endpoints at the vertex.Each ray will go through\\the points less than and greater than the vertex.}")) → text1_{35}LaTeX((("\text{The \textcolor{#000099}{\mathit{y}}-value of the graph is Zadie’s distance from her house.When \textcolor{#000099}{\mathit{y} = 0},\\Zadie is at her house.Zadie will arrive at her house after \textcolor{#000099}{{" * b) * "}} seconds.}")) → text1_{38}Segment(U, V) → nFitLineY({V, W}) → pIntersect(p, n) → ZPoint(p) → A_1Vector(Z, W) → qLaTeX("\text{\mathit{d}}") → text4_1LaTeX("\text{\mathbf{Coordinate:} A coordinate is a number in an ordered pair that names the location\\ of a point on the coordinate plane. }") → text4_2LaTeX("\text{\mathbf{Graph:} A diagram showing the relation between variable quantities,typically\\ of two variables,each measured along one of a pair of axes at right\\ angles.}") → text4LaTeX("\text{\mathit{t}}") → text4_4LaTeX((((("\text{Function \textcolor{#000099}{\mathit{d}={" * a) * "|\mathit{t}-{") * b) * "}|}}}")) → text4_3LaTeX("\text{\mathbf{Note}\mathbf{:} Use the (Data Kit) \\to return to the original \\problem or randomly generate \\a similar practice problem.\\Use the (Definition) to \\review words to know.}") → text3LaTeX((((("\text{A software program can show a user how far he or she is from a\\location on a map.Zadie is walking in a straight line down her street.\\For any time \textcolor{#000099}{\mathit{t}},in seconds,her distance \textcolor{#000099}{\mathit{d}} from her home,in feet,can\\be represented by the function \textcolor{#000099}{\mathit{d} = {" * a) * "}|\mathit{t} −{") * b) * "}|}.Create a graph to show\\Zadie’s distance from her house.Which point on the graph shows when\\Zadie has reached her house?}")) → text1LaTeX("\text{For an absolute value function of the form \textcolor{#000099}{\mathit{y} = \mathit{a}|\mathit{x} − \mathit{h}| + \mathit{k}},there is one\\extreme value for the range at \textcolor{#000099}{\mathit{y} = \mathit{k}}.If \textcolor{#000099}{\mathit{a}} in the general form \textcolor{#000099}{\mathit{y} = \mathit{a}|\mathit{x} − \mathit{h}| + \mathit{k}}\\is positive,the extreme value is the minimum of the range,and there is no\\maximum of the range.If \textcolor{#000099}{\mathit{a}} in the general form \textcolor{#000099}{\mathit{y} = \mathit{a}|\mathit{x} − \mathit{h}| + \mathit{k}} is negative,\\the extreme value is the maximum of the range,and there is no\\minimum of the range.}") → text1_3LaTeX("\text{If \textcolor{#000099}{\mathit{a}} in the general form \textcolor{#000099}{\mathit{y} =\mathit{a}|\mathit{x} − \mathit{h}| + \mathit{k}} is positive,the vertex is a minimum\\of the function.If \textcolor{#000099}{\mathit{a}} in the general form \textcolor{#000099}{\mathit{y} =\mathit{a}|\mathit{x} − \mathit{h}| + \mathit{k}} is negative,the\\vertex is a maximum of the function.For the function \textcolor{#000099}{\mathit{d} = 4|\mathit{t} −20|, \mathit{a} > 0}.}") → text1_{12}LaTeX((("\text{The input value of the vertex is \textcolor{#000099}{\mathit{t} = {" * b) * "}}.The domain of the function is\\restricted to \textcolor{#000099}{\mathit{t} ≥ 0},since \textcolor{#000099}{\mathit{t}} represents time.Evaluate the function at \textcolor{#000099}{\mathit{t} = 0}\\to find the point at the minimum of the domain.This point has an input less\\than the input of the vertex.}")) → text1_{13}LaTeX("\text{Substitute \textcolor{#000099}{0} for \textcolor{#000099}{\mathit{t}}}.") → text1_{17}LaTeX("\text{Simplify.") → text1_{20}LaTeX("\text{Simplify}.") → text1_{29}LaTeX("\text{Substitute \textcolor{#000099}{30} for \textcolor{#000099}{\mathit{t}}}.") → text1_{30}
AI 绘图提示语参考
绘制一个阶梯函数和单位圆的关系图。首先画出一个阶梯函数的图形,包括几个关键点和线段。接着,画出单位圆,并展示其与x轴的交点。最后,通过动态点展示单位圆上的点如何移动,同时标注单位圆的圆心和半径。
以上提示语为根据原始绘图命令整理而来,仅供参考。