
2019年H2M几何题8
几何画板及绘图内容加载中,请稍等……
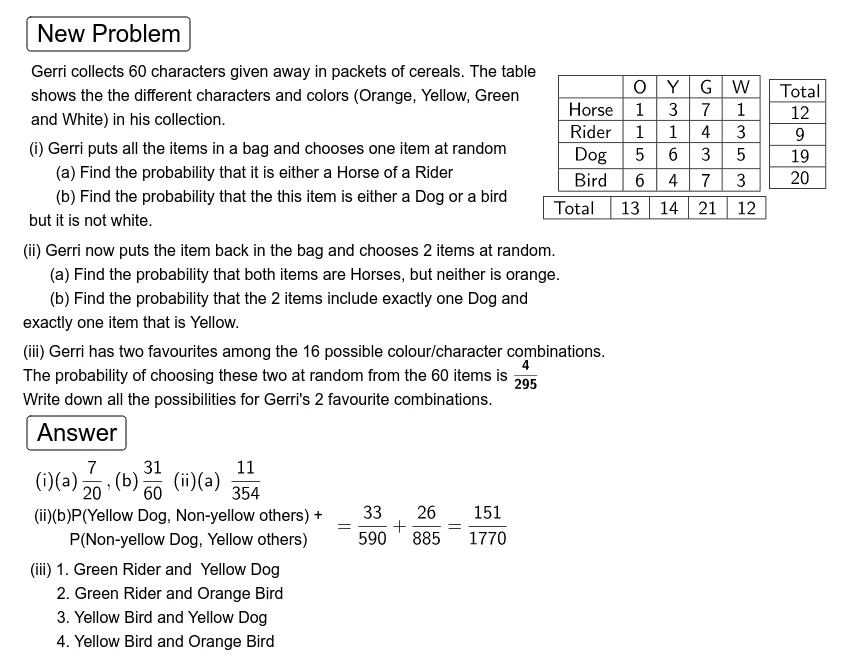
该范例演示了2019年H2M几何题8中的概率问题。涉及的核心数学概念包括概率统计和函数图像。通过随机生成数据和动态调整,展示了如何利用GeoGebra命令如Random、Shuffle、If等构造动态几何图形。适合高中数学教学和学习。
GeoGebra 命令及参数
Random(1, 3) → aShuffle({1, 1, 1, 1, 1, 1, 1, 1, 4, 4, 5, 5, 6, 6, 7, 7}) → l14, {1, 6, 1, 4, 6, 5, 7, 5, 1, 7, 1, 1, 1, 1, 1, 4}Shuffle({1, 1, 1, 1, 1, 1, 3, 3, 4, 4, 5, 5, 6, 6, 7, 7}) → l15, {1, 7, 1, 4, 1, 6, 3, 3, 7, 1, 1, 5, 5, 4, 6, 1}Shuffle({1, 1, 1, 1, 3, 3, 3, 3, 4, 4, 5, 5, 6, 6, 7, 7}) → l16, {1, 7, 3, 3, 4, 4, 6, 6, 7, 5, 3, 1, 5, 1, 3, 1}If(g ≟ 1, l14, If[g ≟ 2, l15, l16]) → l17Sum(l17) → nSequence(Random[1, 16], i, 1, n) → l1Sequence(Element[l17, i], i, 1, 4) → l2Sequence(Element[l17, i], i, 5, 8) → l3Sequence(Element[l17, i], i, 9, 12) → l4Sequence(Element[l17, i], i, 13, 16) → l5Sum(l2) → s1Sum(l3) → s2Sum(l4) → s3Sum(l5) → s4Join({{"Horse"}, l2}) → l7Join({{"Rider"}, l3}) → l8Join({{"Dog"}, l4}) → l9Join({{"Bird"}, l5}) → l10Join({{"Total "}, l6}) → l11TableText(l12, l7, l8, l9, l10, "c|_") → text1TableText(l11, "c|_") → text5TableText(l13, "c|_") → text6IndexOf(4, l17) → bIndexOf(4, l17, b + 1) → cIf(a ≟ 1, IndexOf[6, l17], If[a ≟ 2, IndexOf[5, l17], IndexOf[7, l17]]) → dIf(a ≟ 1, IndexOf[6, l17, d + 1], If[a ≟ 2, IndexOf[5, l17, d + 1], IndexOf[7, l17, d + 1]]) → eIf(Mod[b, 4] ≟ 1, "Orange", If[Mod[b, 4] ≟ 2, "Yellow", If[Mod[b, 4] ≟ 3, "Green", "White"]]) → text12If(b ≤ 4, "Horse", If[b ≤ 8, "Rider", If[b ≤ 12, "Dog", "Bird"]]) → text13If(Mod[c, 4] ≟ 1, "Orange", If[Mod[c, 4] ≟ 2, "Yellow", If[Mod[c, 4] ≟ 3, "Green", "White"]]) → text14If(c ≤ 4, "Horse", If[c ≤ 8, "Rider", If[c ≤ 12, "Dog", "Bird"]]) → text15If(Mod[d, 4] ≟ 1, "Orange", If[Mod[d, 4] ≟ 2, "Yellow", If[Mod[d, 4] ≟ 3, "Green", "White"]]) → text16If(d ≤ 4, "Horse", If[d ≤ 8, "Rider", If[d ≤ 12, "Dog", "Bird"]]) → text17If(Mod[e, 4] ≟ 1, "Orange", If[Mod[e, 4] ≟ 2, "Yellow", If[Mod[e, 4] ≟ 3, "Green", "White"]]) → text18If(e ≤ 4, "Horse", If[e ≤ 8, "Rider", If[e ≤ 12, "Dog", "Bird"]]) → text19If(a ≟ 1, 48 / ((n * (n - 1))), If[a ≟ 2, 40 / ((n * (n - 1))), 56 / ((n * (n - 1)))]) → f
AI 绘图提示语参考
绘制一个概率统计相关的动态几何图形,包含随机生成的数字序列和分类统计结果。首先生成三个随机序列,分别代表不同类别的数量,然后根据这些数量动态分配数字到五个组中。接着计算每个组的总和,并将总和与类别标签结合显示。最后,根据随机选择的类别和索引,确定特定元素的颜色和类别,并显示相关概率计算结果。
以上提示语为根据原始绘图命令整理而来,仅供参考。