
利用反函数图像求函数值
几何画板及绘图内容加载中,请稍等……
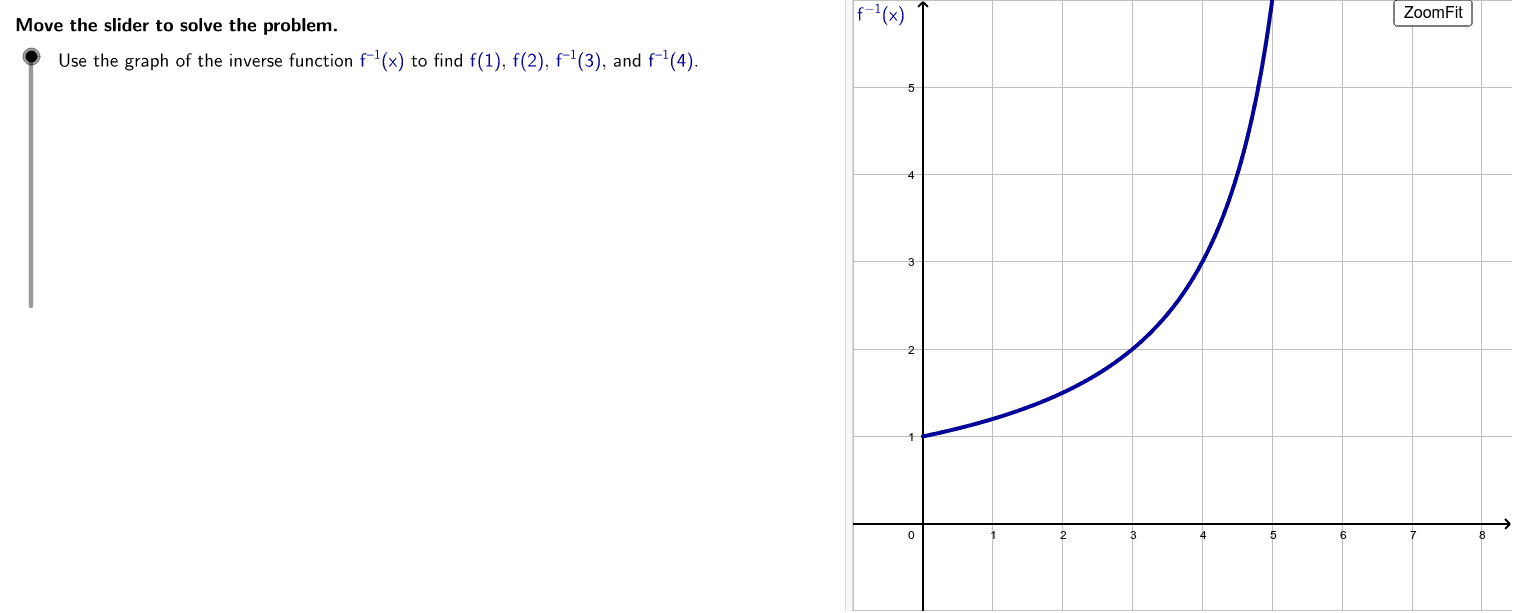
①本范例通过绘制反函数图像来演示如何求解函数值和反函数值;②涉及的核心数学概念包括反函数、函数图像的对称性、坐标点的对应关系;③作图要点使用了GeoGebra命令LaTeX、Corner、If、Vector,对象包括stepMax、stepper、steps、counter、text0等,用于动态展示和计算;④适合高中阶段学习函数性质和反函数的学生使用。
GeoGebra 命令及参数
LaTeX(steps) → counterLaTeX("\text{Move the slider to solve the problem.}") → text0Corner(1) → ACorner(3) → BIf(set ≟ 1, If[0 ≤ x ≤ 6,-6 / (x - 6)], If[set ≟ 2, If[6 ≤ x ≤ 12,-6 / (x - 6)], If[set ≟ 3, If[-6 ≤ x ≤ 0,6 / (x + 6)], If[-12 ≤ x ≤ -6,6 / (x + 6)]]]) → inverseIf(set ≟ 1, -1, If[set ≟ 2, -7, If[set ≟ 3, -1, -7]]) → yminLaTeX("\textcolor{#000099}{f^{-1}(x)}") → labelIf(set ≟ 1, 1, If[set ≟ 2, -6, If[set ≟ 3, 6, -2]]) → v1If(set ≟ 1, 2, If[set ≟ 2, -1, If[set ≟ 3, 2, -3]]) → v2If(set ≟ 1, 3, If[set ≟ 2, 8, If[set ≟ 3, -3, -12]]) → v3If(set ≟ 1, 4, If[set ≟ 2, 9, If[set ≟ 3, -4, -9]]) → v4If(set ≟ 1, 0, If[set ≟ 2, 7, If[set ≟ 3, -5, -9]]) → m1If(set ≟ 1, 3, If[set ≟ 2, 12, If[set ≟ 3, -3, -8]]) → m2If(set ≟ 1, 2, If[set ≟ 2, -3, If[set ≟ 3, 2, -1]]) → m3If(set ≟ 1, 3, If[set ≟ 2, 2, If[set ≟ 3, 3, -2]]) → m4If(set ≟ 1, (0, 1), If[set ≟ 2, (0, -6), If[set ≟ 3, (0, 6), (0, -2)]]) → pstart1If(set ≟ 1, (0, 2), If[set ≟ 2, (0, -1), If[set ≟ 3, (0, 2), (0, -3)]]) → pstart2If(set ≟ 1, (3, 0), If[set ≟ 2, (8, 0), If[set ≟ 3, (-3, 0), (-12, 0)]]) → pstart3If(set ≟ 1, (4, 0), If[set ≟ 2, (9, 0), If[set ≟ 3, (-4, 0), (-9, 0)]]) → pstart4If(set ≟ 1, (0, 0), If[set ≟ 2, (7, 0), If[set ≟ 3, (-5, 0), (-9, 0)]]) → pend1If(set ≟ 1, (3, 0), If[set ≟ 2, (12, 0), If[set ≟ 3, (-3, 0), (-8, 0)]]) → pend2If(set ≟ 1, (0, 2), If[set ≟ 2, (0, -3), If[set ≟ 3, (0, 2), (0, -1)]]) → pend3If(set ≟ 1, (0, 3), If[set ≟ 2, (0, -2), If[set ≟ 3, (0, 3), (0, -2)]]) → pend4If(set ≟ 1, (0, 1), If[set ≟ 2, (7, -6), If[set ≟ 3, (-5, 6), (-9, -2)]]) → p1If(set ≟ 1, (3, 2), If[set ≟ 2, (12, -1), If[set ≟ 3, (-3, 2), (-8, -3)]]) → p2If(set ≟ 1, (3, 2), If[set ≟ 2, (8, -3), If[set ≟ 3, (-3, 2), (-12, -1)]]) → p3If(set ≟ 1, (4, 3), If[set ≟ 2, (9, -2), If[set ≟ 3, (-4, 3), (-9, -2)]]) → p4Vector(pstart1, p1) → trace1aVector(pstart2, p2) → trace2aVector(pstart3, p3) → trace3aVector(pstart4, p4) → trace4aVector(p1, pend1) → trace1bVector(p2, pend2) → trace2bVector(p3, pend3) → trace3bVector(p4, pend4) → trace4bLaTeX("\text{Move left or right to the graph of }\textcolor{#000099}{f^{-1}(x)}.") → text5If(set ≟ 1, 0, If[set ≟ 2, 7, If[set ≟ 3, -5, -9]]) → m1_1LaTeX("\text{Move left or right to the graph of }\textcolor{#000099}{f^{-1}(x)}.") → text11If(set ≟ 1, -1, If[set ≟ 2, -1, If[set ≟ 3, -7, -13]]) → xminIf(set ≟ 1, 7, If[set ≟ 2, 13, If[set ≟ 3, 1, 1]]) → xmaxIf(set ≟ 1, (6, inverse(6)), If[set ≟ 2, (7, inverse(7)), If[set ≟ 3, ((-5), inverse((-5))), (-9, -2)]]) → CIf(set ≟ 1, 6, If[set ≟ 2, 1, If[set ≟ 3, 7, 1]]) → ymaxLaTeX("\text{Use the buttons below to return to the original problem or}\cr\text{randomly generate a similar practice problem.}") → RandomizationTextLaTeX((("\text{Find the function value }\textcolor{#000099}{f(" * v1) * ")}\text{ from the graph of the inverse function }\textcolor{#000099}{f^{–1}(x)}.")) → text1LaTeX((((((((("\text{Use the graph of the inverse function }\textcolor{#000099}{f^{–1}(x)}\text{ to find }\textcolor{#000099}{f(" * v1) * ")}\text{, }\textcolor{#000099}{f(") * v2) * ")}\text{, }\textcolor{#000099}{f^{–1}(") * v3) * ")}\text{, and }\textcolor{#000099}{f^{–1}(") * v4) * ")}.")) → ProblemLaTeX((((("\text{To find the value of }\textcolor{#000099}{f(x)}\text{ at }\textcolor{#000099}{x = " * v1) * "}\text{ from the graph of the inverse function }\textcolor{#000099}{f^{–1}(x)},\cr\text{locate the value }\textcolor{#000099}{") * v1) * "}\text{ on the }\textcolor{#000099}{y}\text{-axis of the graph.}")) → text4LaTeX("\text{Now move up or down from the point on the graph to the }\textcolor{#000099}{x}\text{-axis.}") → text6LaTeX((((("\text{The }\textcolor{#000099}{x}\text{-coordinate, }\textcolor{#000099}{" * m1) * "}\text{, where this vertical line hits the }\textcolor{#000099}{x}\text{-axis represents the output }\cr\text{value of }\textcolor{#000099}{f(x)}\text{ at an input value of }\textcolor{#000099}{x=") * v1) * "}.")) → text7LaTeX((("\text{Find the function value }\textcolor{#000099}{f(" * v2) * ")}\text{ from the graph of the inverse function }\textcolor{#000099}{f^{–1}(x)}.")) → text9LaTeX((((("\text{To find the value of }\textcolor{#000099}{f(x)}\text{ at }\textcolor{#000099}{x = " * v2) * "}\text{ from the graph of the inverse function }\textcolor{#000099}{f^{–1}(x)},\cr\text{locate the value }\textcolor{#000099}{") * v2) * "}\text{ on the }\textcolor{#000099}{y}\text{-axis of the graph.}")) → text10LaTeX("\text{Now move up or down from the point on the graph to the }\textcolor{#000099}{x}\text{-axis.}") → text12LaTeX((((("\text{The }\textcolor{#000099}{x}\text{-coordinate, }\textcolor{#000099}{" * m2) * "}\text{, where this vertical line hits the }\textcolor{#000099}{x}\text{-axis represents the output }\cr\text{value of }\textcolor{#000099}{f(x)}\text{ at an input value of }\textcolor{#000099}{x=") * v2) * "}.")) → text13LaTeX((("\text{Find the inverse function value }\textcolor{#000099}{f^{-1}(" * v3) * ")}\text{ from the graph of the inverse function }\textcolor{#000099}{f^{–1}(x)}.")) → text15LaTeX("\text{Remember that this is a graph of the inverse function }\textcolor{#000099}{f^{–1}(x)}\text{, and not a graph of the }\cr\text{function }\textcolor{#000099}{f(x)}\text{. That means the values of the inverse function }\textcolor{#000099}{f^{–1}(x)}\text{ are read from the }\cr\text{graph in the usual way, with the }\textcolor{#000099}{x}\text{-axis as the input.}") → text16LaTeX((((("\text{To find the value of }\textcolor{#000099}{f^{–1}(x)}\text{ at }\textcolor{#000099}{x = " * v3) * "}\text{ from the graph, locate }\textcolor{#000099}{") * v3) * "}\text{ on the }\textcolor{#000099}{x}\text{-axis.}")) → text17LaTeX((("\text{Find the inverse function value }\textcolor{#000099}{f^{-1}(" * v4) * ")}\text{ from the graph of the {inverse function }\textcolor{#000099}{f^{–1}(x)}.")) → text20LaTeX((((("\text{To find the value of }\textcolor{#000099}{f^{–1}(x)}\text{ at }\textcolor{#000099}{x = " * v4) * "}\text{ from the graph, locate }\textcolor{#000099}{") * v4) * "}\text{ on the }\textcolor{#000099}{x}\text{-axis.}")) → text21LaTeX("\text{Notice that this is a graph of the inverse function }\textcolor{#000099}{f^{–1}(x)}\text{, and not a graph of the}\cr\text{function }\textcolor{#000099}{f(x)}\text{. Also remember that the inverse of }\textcolor{#000099}{f^{–1}(x)}\text{ is the original function }\textcolor{#000099}{f(x)}.") → text2LaTeX("\text{Because the inverse relationship between }\textcolor{#000099}{f(x)}\text{ and }\textcolor{#000099}{f^{–1}(x)}\text{ goes both ways, you can use}\cr\text{the graph of the inverse function }\textcolor{#000099}{f^{–1}(x)}\text{ to find values of the original function }\textcolor{#000099}{f(x)}.") → text3LaTeX((((("\text{Therefore, }\textcolor{#000099}{f(" * v1) * ")=") * m1) * "}.")) → text8LaTeX((((("\text{That is, }\textcolor{#000099}{f(" * v2) * ")=") * m2) * "}.")) → text14LaTeX((((((("\text{Then find the point on the function directly above or below }\textcolor{#000099}{x = " * v3) * "}\text{;}\cr\text{in this case, }\textcolor{#000099}{(") * v3) * ", ") * m3) * ")}.")) → text18LaTeX((((((((("\text{The }\textcolor{#000099}{y}\text{-coordinate, }\textcolor{#000099}{" * m3) * "}\text{, of this point is the value of }\textcolor{#000099}{f^{–1}(x)}\text{ at }\textcolor{#000099}{x = ") * v3) * "}\text{.}\cr\text{Therefore, }\textcolor{#000099}{f^{–1}(") * v3) * ") = ") * m3) * "}.")) → text19LaTeX((((((("\text{Then find the point on the function directly above or below }\textcolor{#000099}{x = " * v4) * "}\text{;}\cr\text{in this case, }\textcolor{#000099}{(") * v4) * ", ") * m4) * ")}.")) → text22LaTeX((((((((("\text{The }\textcolor{#000099}{y}\text{-coordinate, }\textcolor{#000099}{" * m4) * "}\text{, of this point is the value of }\textcolor{#000099}{f^{–1}(x)}\text{ at }\textcolor{#000099}{x = ") * v4) * "}\text{.}\cr\text{Therefore, }\textcolor{#000099}{f^{–1}(") * v4) * ") = ") * m4) * "}.")) → text23
AI 绘图提示语参考
画一个函数及其反函数的图像,展示如何通过反函数图像找到函数值。关键对象包括函数图像、反函数图像、坐标轴和几个关键点。首先画出函数图像,然后画出反函数图像,并标出反函数的标签。接着,通过几个关键点展示如何从反函数图像找到对应的函数值,包括在坐标轴上的交点和垂直线的位置。最后,动态显示滑动条和文本说明,解释如何通过反函数图像找到函数值。
以上提示语为根据原始绘图命令整理而来,仅供参考。