
Year 7 Statistics and Data Analysis
Loading the math board and drawing, please wait…
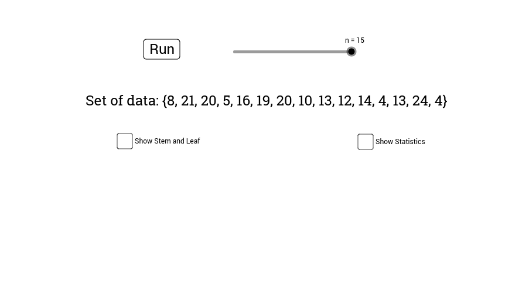
This example demonstrates how to use GeoGebra for statistical data analysis, including calculating mean, median, mode, max, min, and range. Core math concepts involved include mean, median, mode, statistical charts (like bar charts), and probability & statistics. Key construction points involve using GeoGebra commands and objects such as Mode, Mean, Max, Min, StemPlot, Sum, Median. Suitable for Year 7 students to learn and understand basic statistical methods and how to visualize data using tools like bar charts.
GeoGebra Commands & Parameters
Mode(L) → modeMean(L) → meanMax(L) → maxMin(L) → minStemPlot(L) → text1Sum(L) → sumMedian(L) → median
AI Drawing Prompt Reference
Create a statistical analysis chart for a set of data, including calculating mean, median, mode, maximum, minimum, and range. Use a stem-and-leaf plot to show data distribution and a bar chart to visualize the data. First, input the data list, then calculate the mean, median, mode, maximum, minimum, and range, and finally generate the stem-and-leaf plot and bar chart.
The prompt above was compiled from the original drawing commands and is for reference only.