
Linear Transformations of Reciprocal Functions
Loading the math board and drawing, please wait…
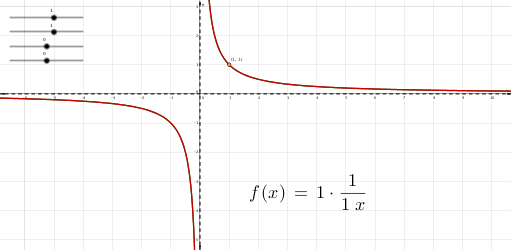
① This GeoGebra example dynamically illustrates how linear transformations (translation and scaling) affect the graph of a reciprocal function such as y=1/x, showing the graph shifting and stretching as parameters change. ② Core mathematical concepts include reciprocal functions, linear transformations (translation and dilation), asymptotes, and the relationship between parameters and graph shape/position. ③ Construction details: Based on the summary, LaTeX commands generate function expressions; objects include g (function graph), A (point), sliders a, b, c, d (parameters), f (transformed function), B (point), text1 (label), and h, i (likely auxiliary lines or asymptotes). Sliders enable dynamic parameter adjustment for interactive exploration. ④ Suitable for high school or pre-university students learning function transformations, useful for classroom demonstrations or self-study to understand how parameter changes affect reciprocal function graphs, bridging to hyperbolas and quadratic functions.
GeoGebra Commands & Parameters
LaTeX(f, true, true) → text1
AI Drawing Prompt Reference
Draw a graph of a reciprocal function starting as y=1/x, showing its linear transformations. Include four adjustable sliders for horizontal translation, vertical translation, horizontal scaling, and vertical scaling. As sliders change, the hyperbola shifts or stretches accordingly, with two asymptotes (one horizontal, one vertical) moving with the graph. Mark a dynamic point on the curve whose coordinates update with parameters, and display the transformed function expression as text nearby. The scene illustrates how translation and dilation affect the reciprocal function's graph.
The prompt above was compiled from the original drawing commands and is for reference only.