
Visualising Complex Solutions to Quadratic Functions
Loading the math board and drawing, please wait…
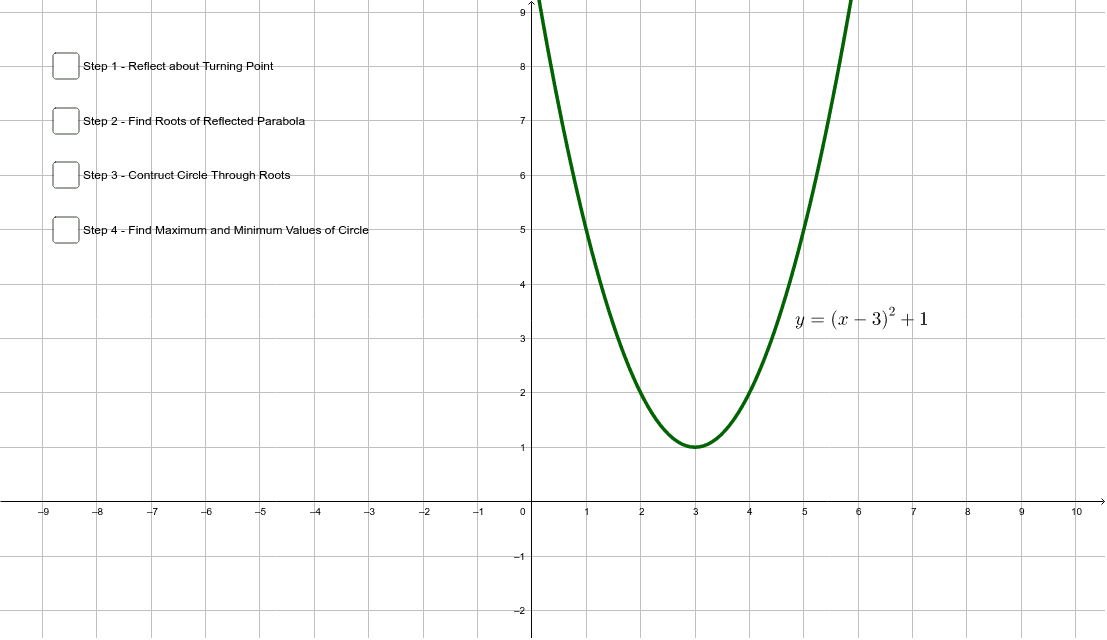
① This example demonstrates how complex solutions of a quadratic function, which has no real roots, can be visualised geometrically in a 3D construction, linking the complex plane to the function's graph and geometric solids like cones. ② Core mathematical concepts include quadratic functions, complex roots, the complex plane, function graphing, and geometric transformations such as reflection, midpoint, circle, and perpendicular lines. ③ Construction highlights: using GeoGebra commands such as Mirror, Root, Midpoint, Circle, OrthogonalLine, Intersect, and Point, with objects including the function f and its mirror f_1, points A, B, C, circle c, line g, points D, E, segments a, b, d, e, auxiliary lines h, i, j, k, text labels text1/text2/text3, and point F, to connect algebraic solutions with geometric positions. ④ Suitable for high school to early university students, this helps learners grasp the geometric meaning of complex solutions and serves as a teaching aid for demonstrating the relationship between complex numbers and functions, breaking through abstract conceptual barriers.
GeoGebra Commands & Parameters
Mirror(f, Extremum[f]) → f_1Root(f_1) → A, BMidpoint(A, B) → CCircle(C, B) → cOrthogonalLine(C, xAxis) → gIntersect(c, g, 2) → DIntersect(c, g, 1) → EPoint(f) → F
AI Drawing Prompt Reference
Visualize the complex solutions of a quadratic function without real roots geometrically in 3D, linking the complex plane to the function's graph and cones. Start by plotting the function, then mirror it to create a reflected image. Find the roots of the reflected image, calculate their midpoint, and draw a circle centered at the midpoint with the radius equal to the distance from the midpoint to a root. Draw a perpendicular line from the circle to the x-axis to get two intersection points. Finally, mark the corresponding point on the original function graph to represent the complex solutions.
The prompt above was compiled from the original drawing commands and is for reference only.