
Writing Equations to Represent Tables
Loading the math board and drawing, please wait…
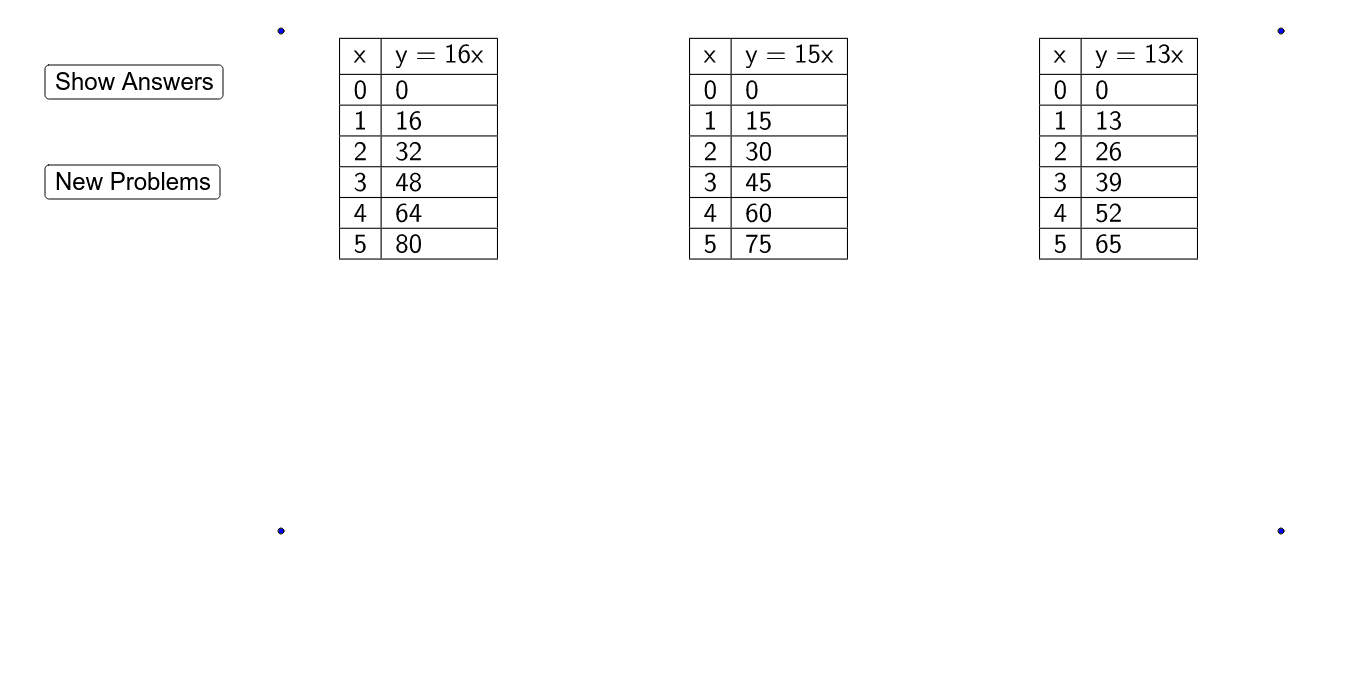
This GeoGebra example demonstrates how to use table features and random commands to generate equations from tabular data, visualizing the relationship between input coefficients and resulting graphs. Core mathematical concepts include function representation, equation construction, data handling from tables, and the role of random variables in mathematical modeling. Construction leverages GeoGebra commands such as Random, If, and TableText, along with objects like buttons, coefficients, labels, and function graphs (Y1, yLabel1-6) to dynamically create and display table-based equation systems. It is suitable for high school algebra, functions units, statistics introductions, and inquiry-based learning, helping students understand the conversion between tabular data and algebraic equations.
GeoGebra Commands & Parameters
Random(1, 20) → coefficientX2Random(1, 20) → coefficientX3Random(1, 20) → coefficientX4Random(1, 20) → coefficientX5Random(1, 20) → coefficientX6Random(1, 20) → coefficientX1If(ShowAnswers ≟ true, (("y = " * coefficientX1) * "x"), "y") → yLabel1If(ShowAnswers ≟ true, (("y = " * coefficientX2) * "x"), "y") → yLabel2If(ShowAnswers ≟ true, (("y = " * coefficientX3) * "x"), "y") → yLabel3If(ShowAnswers ≟ true, (("y = " * coefficientX4) * "x"), "y") → yLabel4If(ShowAnswers ≟ true, (("y = " * coefficientX5) * "x"), "y") → yLabel5If(ShowAnswers ≟ true, (("y = " * coefficientX6) * "x"), "y") → yLabel6TableText({{A1, B1}, {A2, B2}, {A3, B3}, {A4, B4}, {A5, B5}, {A6, B6}, {A7, B7}}, "|_") → Table1TableText({{D1, E1}, {D2, E2}, {D3, E3}, {D4, E4}, {D5, E5}, {D6, E6}, {D7, E7}}, "|_") → Table2TableText({{G1, H1}, {G2, H2}, {G3, H3}, {G4, H4}, {G5, H5}, {G6, H6}, {G7, H7}}, "|_") → Table3TableText({{J1, K1}, {J2, K2}, {J3, K3}, {J4, K4}, {J5, K5}, {J6, K6}, {J7, K7}}, "|_") → Table4TableText({{M1, N1}, {M2, N2}, {M3, N3}, {M4, N4}, {M5, N5}, {M6, N6}, {M7, N7}}, "|_") → Table5TableText({{P1, Q1}, {P2, Q2}, {P3, Q3}, {P4, Q4}, {P5, Q5}, {P6, Q6}, {P7, Q7}}, "|_") → Table6
AI Drawing Prompt Reference
Create a math teaching graphic showing six separate tables, each with two columns of data representing input and output values. Next to each table, display a linear equation of the form y equals a random coefficient times x. The coefficients are random integers between 1 and 20. Include a toggle button that controls whether the full equation is shown: when off, only 'y' is displayed; when on, the complete 'y = coefficient x' appears. The layout should clearly illustrate the relationship between tabular data and linear equations.
The prompt above was compiled from the original drawing commands and is for reference only.