
Writing Equations from Tables 010.2
Loading the math board and drawing, please wait…
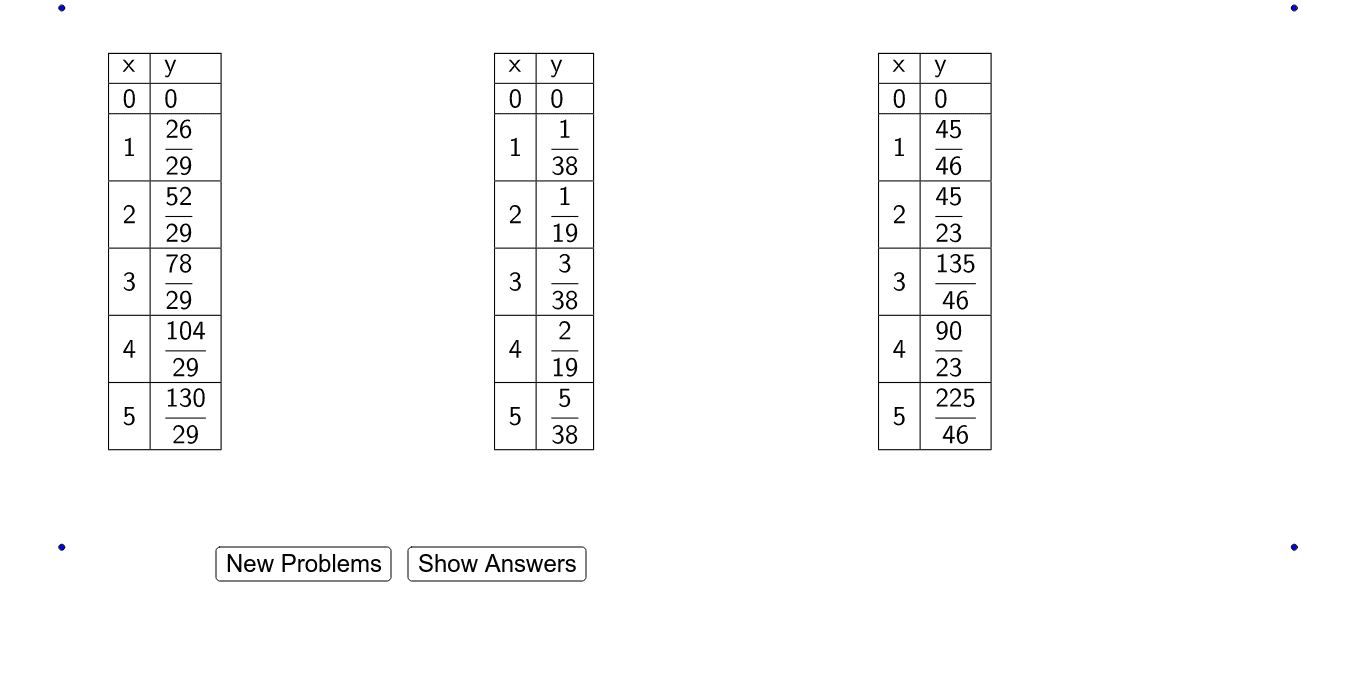
This GeoGebra example demonstrates how to derive linear equations from given numerical tables and visualize the corresponding functions dynamically, helping students build connections among tabular data, algebraic equations, and function graphs. Core mathematical concepts include linear functions, slope and intercept, variable relationships, and translating numerical patterns into symbolic expressions. The construction uses GeoGebra commands Random to generate variable coefficients, If for conditional logic and answer visibility, FractionText and TableText to format fractional table entries, and interactive objects such as button1, button2, and ShowAnswers for user control. Coefficient objects coefficientX1 through coefficientX6, numerator and denominator series, along with labels yLabel1 to yLabel6 and points A1, B1, D1, determine table values and the position of line Y1. Suitable for middle school algebra or high school function review, supporting teacher demonstration and student practice in writing equations from tables with immediate answer checking.
GeoGebra Commands & Parameters
Random(2, 100) → denominator6Random(2, 100) → denominator5Random(1, denominator6) → numerator6Random(2, 100) → denominator4Random(1, denominator5) → numerator5Random(2, 100) → denominator1Random(2, 100) → denominator3Random(1, denominator4) → numerator4Random(2, 100) → denominator2Random(1, denominator3) → numerator3Random(1, denominator2) → numerator2Random(1, denominator1) → numerator1If(ShowAnswers ≟ true, (("y = " * FractionText[coefficientX1]) * "x"), "y") → yLabel1If(ShowAnswers ≟ true, (("y = " * FractionText[coefficientX2]) * "x"), "y") → yLabel2If(ShowAnswers ≟ true, (("y = " * FractionText[coefficientX3]) * "x"), "y") → yLabel3If(ShowAnswers ≟ true, (("y = " * FractionText[coefficientX4]) * "x"), "y") → yLabel4If(ShowAnswers ≟ true, (("y = " * FractionText[coefficientX5]) * "x"), "y") → yLabel5If(ShowAnswers ≟ true, (("y = " * FractionText[coefficientX6]) * "x"), "y") → yLabel6FractionText((A2 * coefficientX1)) → B2FractionText((A3 * coefficientX1)) → B3FractionText((A4 * coefficientX1)) → B4FractionText((A5 * coefficientX1)) → B5FractionText((A6 * coefficientX1)) → B6FractionText((A7 * coefficientX1)) → B7FractionText((D2 * coefficientX2)) → E2FractionText((D3 * coefficientX2)) → E3FractionText((D4 * coefficientX2)) → E4FractionText((D5 * coefficientX2)) → E5FractionText((D6 * coefficientX2)) → E6FractionText((D7 * coefficientX2)) → E7FractionText((G2 * coefficientX3)) → H2FractionText((G3 * coefficientX3)) → H3FractionText((G4 * coefficientX3)) → H4FractionText((G5 * coefficientX3)) → H5FractionText((G6 * coefficientX3)) → H6FractionText((G7 * coefficientX3)) → H7FractionText((J2 * coefficientX4)) → K2FractionText((J3 * coefficientX4)) → K3FractionText((J4 * coefficientX4)) → K4FractionText((J5 * coefficientX4)) → K5FractionText((J6 * coefficientX4)) → K6FractionText((J7 * coefficientX4)) → K7FractionText((M2 * coefficientX5)) → N2FractionText((M3 * coefficientX5)) → N3FractionText((M4 * coefficientX5)) → N4FractionText((M5 * coefficientX5)) → N5FractionText((M6 * coefficientX5)) → N6FractionText((M7 * coefficientX5)) → N7FractionText((P2 * coefficientX6)) → Q2FractionText((P3 * coefficientX6)) → Q3FractionText((P4 * coefficientX6)) → Q4FractionText((P5 * coefficientX6)) → Q5FractionText((P6 * coefficientX6)) → Q6FractionText((P7 * coefficientX6)) → Q7TableText({{A1, B1}, {A2, B2}, {A3, B3}, {A4, B4}, {A5, B5}, {A6, B6}, {A7, B7}}, "|_") → Table1TableText({{D1, E1}, {D2, E2}, {D3, E3}, {D4, E4}, {D5, E5}, {D6, E6}, {D7, E7}}, "|_") → Table2TableText({{G1, H1}, {G2, H2}, {G3, H3}, {G4, H4}, {G5, H5}, {G6, H6}, {G7, H7}}, "|_") → Table3TableText({{J1, K1}, {J2, K2}, {J3, K3}, {J4, K4}, {J5, K5}, {J6, K6}, {J7, K7}}, "|_") → Table4TableText({{M1, N1}, {M2, N2}, {M3, N3}, {M4, N4}, {M5, N5}, {M6, N6}, {M7, N7}}, "|_") → Table5TableText({{P1, Q1}, {P2, Q2}, {P3, Q3}, {P4, Q4}, {P5, Q5}, {P6, Q6}, {P7, Q7}}, "|_") → Table6
AI Drawing Prompt Reference
The graphic consists of a table and a dynamic function line. The table contains six points, each with a value calculated from a randomly generated coefficient. Six labels appear above, displaying each coefficient. The function line is dynamically generated based on these coefficients. The construction order is: first generate six random coefficients, then calculate the table point coordinates using them, and finally draw the function line and labels.
The prompt above was compiled from the original drawing commands and is for reference only.