
Write Equations Based on Tables by Matthew Zeigler (2)
Loading the math board and drawing, please wait…
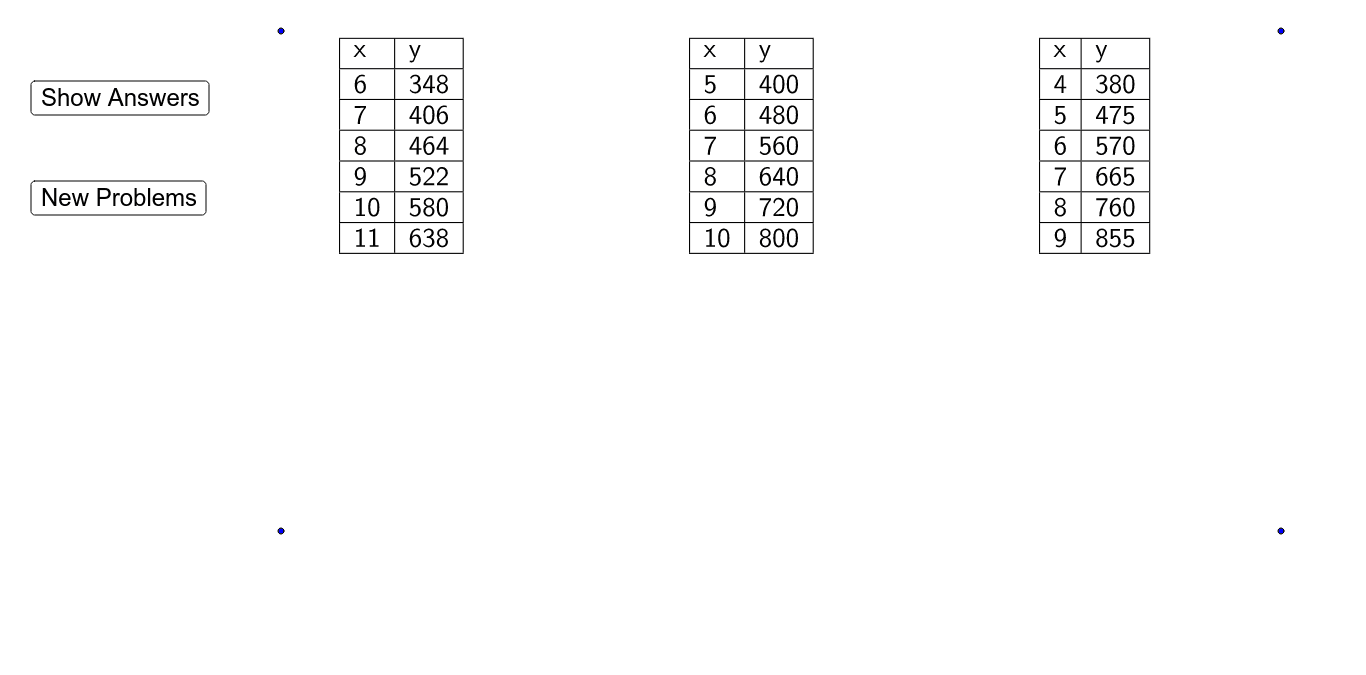
This example guides students to derive equations based on given table data. Key mathematical concepts include functions, statistical characteristics, and arithmetic mean. Using GeoGebra commands such as Random, If, and TableText, students can dynamically explore the relationship between equations and tables. Suitable for middle school and above students to learn function graphs and equation derivation.
GeoGebra Commands & Parameters
Random(1, 10) → StartingX1Random(1, 10) → StartingX2Random(1, 10) → StartingX3Random(1, 10) → StartingX4Random(1, 10) → StartingX5Random(1, 100) → coefficientX1Random(1, 100) → coefficientX2Random(1, 100) → coefficientX3Random(1, 100) → coefficientX4Random(1, 100) → coefficientX5Random(1, 100) → coefficientX6Random(1, 10) → StartingX6If(ShowAnswers ≟ true, (("y = " * coefficientX1) * "x"), "y") → yLabel1If(ShowAnswers ≟ true, (("y = " * coefficientX2) * "x"), "y") → yLabel2If(ShowAnswers ≟ true, (("y = " * coefficientX3) * "x"), "y") → yLabel3If(ShowAnswers ≟ true, (("y = " * coefficientX4) * "x"), "y") → yLabel4If(ShowAnswers ≟ true, (("y = " * coefficientX5) * "x"), "y") → yLabel5If(ShowAnswers ≟ true, (("y = " * coefficientX6) * "x"), "y") → yLabel6TableText({{A1, B1}, {A2, B2}, {A3, B3}, {A4, B4}, {A5, B5}, {A6, B6}, {A7, B7}}, "|_") → Table1TableText({{D1, E1}, {D2, E2}, {D3, E3}, {D4, E4}, {D5, E5}, {D6, E6}, {D7, E7}}, "|_") → Table2TableText({{G1, H1}, {G2, H2}, {G3, H3}, {G4, H4}, {G5, H5}, {G6, H6}, {G7, H7}}, "|_") → Table3TableText({{J1, K1}, {J2, K2}, {J3, K3}, {J4, K4}, {J5, K5}, {J6, K6}, {J7, K7}}, "|_") → Table4TableText({{M1, N1}, {M2, N2}, {M3, N3}, {M4, N4}, {M5, N5}, {M6, N6}, {M7, N7}}, "|_") → Table5TableText({{P1, Q1}, {P2, Q2}, {P3, Q3}, {P4, Q4}, {P5, Q5}, {P6, Q6}, {P7, Q7}}, "|_") → Table6
AI Drawing Prompt Reference
Draw the graphs of five linear functions based on given table data. First, randomly generate the starting x-values and coefficients for each function, then construct the function expressions accordingly. Next, input the data from each table, and finally plot these function graphs on the coordinate system.
The prompt above was compiled from the original drawing commands and is for reference only.