
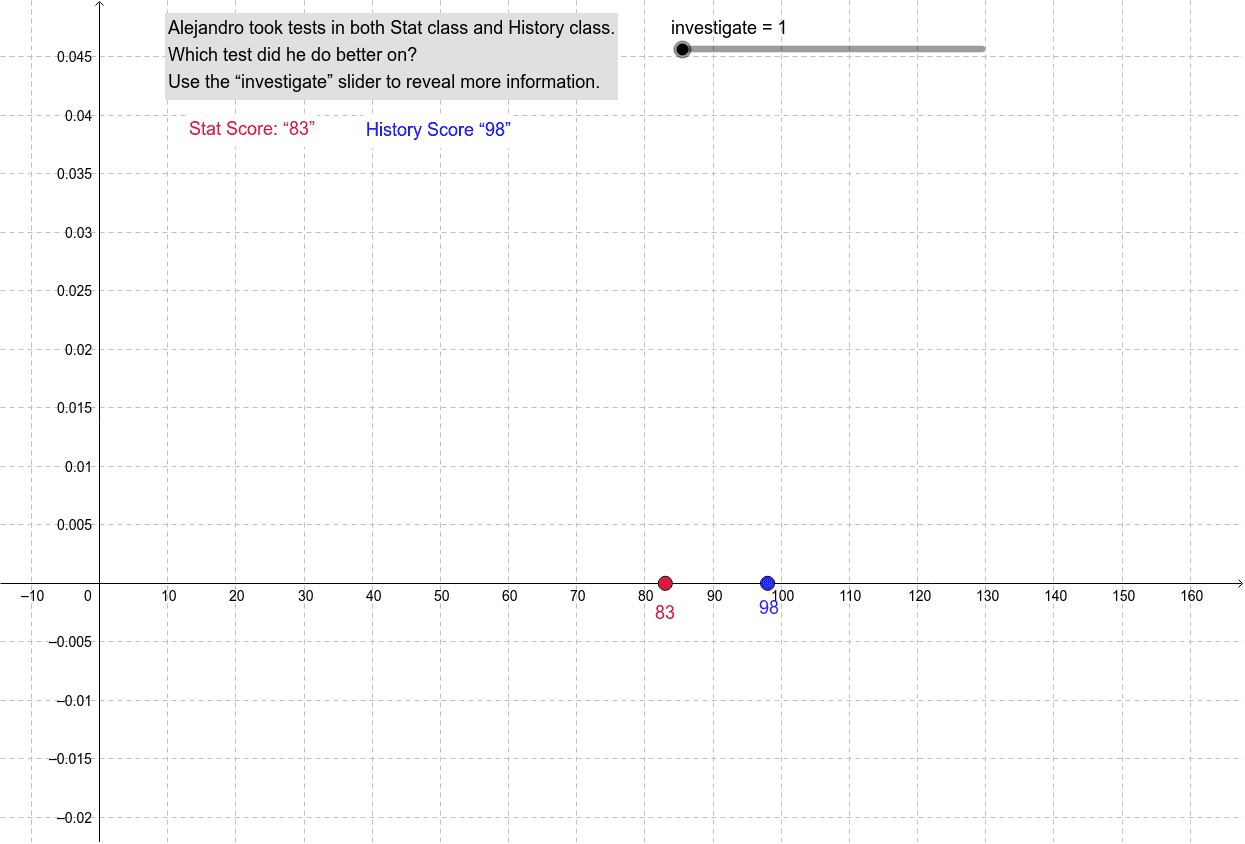
Which Test Did Alejandro Do Better On?
Loading the math board and drawing, please wait…
In collections
Statistical Intuition Builders
This example demonstrates how students analyze the performance difference of a fictional student by comparing two test scores. Core math concepts include means, standard deviations, normal distributions, and bar charts. It uses commands like Textfield, Integral, Segment, Line, Intersect, Point, Mirror, and objects such as σ, σ_2, μ, inputBox1, f, sm, sd, hm, hd, h, s, a, b, A, B, StatPercentile, HistoryPercentile, C, D, E, F, TransformedPercentile, d, e, g, text1, text2, text3, text4, investigate, H_m, S_m, G, c, H, i, I, J, j, k for data analysis and visualization. Suitable for high school mathematics teaching, focusing on probability, statistics, and data analysis for beginners.
GeoGebra Commands & Parameters
Textfield(σ) → σ_2Textfield(μ) → inputBox1Integral(s, -Infinity, x(A)) → StatPercentileIntegral(h, -Infinity, x(B)) → HistoryPercentileIntegral(f, -Infinity, x(E)) → TransformedPercentileSegment(A, C) → eSegment(B, D) → gSegment(S_m, G) → cSegment(H_m, H) → iSegment(I, J) → jLine(C, xAxis) → kLine(D, xAxis) → lIntersect(k, c) → KIntersect(l, i) → LSegment(K, C) → StatZSegment(L, D) → HistoryZPoint(Circle[K, abs(sd)]) → MSegment(K, M) → mPoint(Circle[K, abs((2 * sd))]) → NSegment(K, N) → nPoint(Circle[K, abs((3 * sd))]) → OSegment(K, O) → pMirror(M, c) → M'Mirror(N, c) → N'Mirror(O, c) → O'Point(Circle[L, abs(hd)]) → PSegment(L, P) → qPoint(Circle[L, abs((2 * hd))]) → QSegment(L, Q) → rPoint(Circle[L, abs((3 * hd))]) → RSegment(L, R) → tMirror(P, i) → P'Mirror(Q, i) → Q'Mirror(R, i) → R'