
Which Histogram Has More Variation?
Loading the math board and drawing, please wait…
In collections
Statistics Demonstrations
Statistics Demonstrations
Statistics Demonstrations
Statistics Demonstrations
Statistics Demonstrations
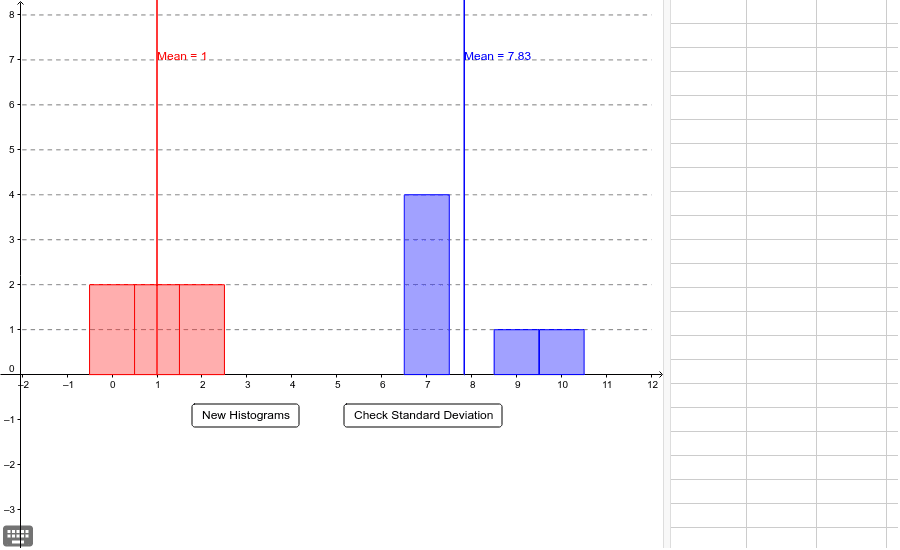
This example demonstrates comparing standard deviations of different histograms to understand data variability. Key math concepts include standard deviation, histogram, and data distribution. Construction involves commands like Random, SD, CurveCartesian, Intersect, BarChart, Sequence, and Mean. Suitable for high school statistics and probability education for visual teaching on judging data variability.
GeoGebra Commands & Parameters
Random(2, 4) → aRandom(6, 8) → bRandom(b, 10) → F6Random(b, 10) → F5Random(b, 10) → F4Random(b, 10) → F3Random(b, 10) → F2Random(b, 10) → F1Random(0, a) → E6Random(0, a) → E5Random(0, a) → E4Random(0, a) → E3Random(0, a) → E2Random(0, a) → E1Random(0, a) → E7Random(b, 10) → F7Random(0, a) → E8Random(b, 10) → F8Random(0, a) → E9Random(b, 10) → F9SD(list3) → gSD(list4) → hCurveCartesian(Mean[list3], a, a, 0, 10) → eIntersect(i, e) → AIntersect(j, e) → BCurveCartesian(Mean[list4], a, a, 0, 10) → fIntersect(i, f) → CIntersect(j, f) → DBarChart(list3, 1) → cBarChart(list4, 1) → dSequence(Segment[(-2, a), (12, a)], a, 1, 15) → list5Mean(list3) → kMean(list4) → l
AI Drawing Prompt Reference
Create two histograms based on randomly generated data sets. Calculate and plot the mean for each data set, then draw the standard deviation curves. Finally, compare the standard deviations of the two histograms to determine which one has more variability.
The prompt above was compiled from the original drawing commands and is for reference only.