
When Is Too Much Overlap Too Much? (Two Distributions)
Loading the math board and drawing, please wait…
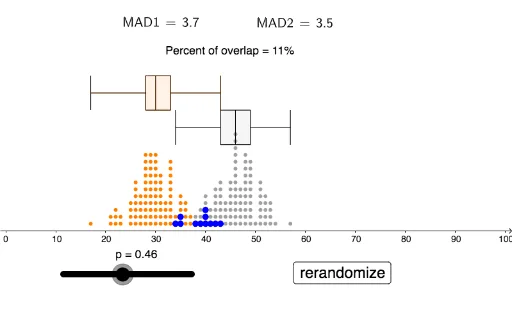
This interactive GeoGebra example visualizes the overlap between two normal (or binomial) distributions and explores how to quantify when the overlap becomes too large to distinguish them. It demonstrates the concept of distribution overlap, mean absolute deviation (MAD), and statistical comparison using dot plots and box plots. The construction uses commands such as Sequence, DotPlot, mad, BoxPlot, LaTeX, Remove, and Length, with objects including sliders for parameters (p, left, right), buttons for interaction, and text displays for dynamic results. It also incorporates geometric elements like equilateral triangles and reflections to aid visualization. Suitable for high school or introductory college statistics courses, this example helps students understand the intuition behind hypothesis testing, effect size, and the role of variability in comparing distributions.
GeoGebra Commands & Parameters
Sequence(RandomBinomial[100, 0.3], w, 1, 100) → leftDotPlot(left, false, 0.2) → leftdotSequence(RandomBinomial[100, p], w, 1, 100) → rightDotPlot(right, false, 0.2) → rightdotmad(left) → MAD1mad(right) → MAD2BoxPlot(4, 0.5, left) → aBoxPlot(3, 0.5, right) → bBoxPlot(4, 0.5, left) → cBoxPlot(3, 0.5, right) → dLaTeX(MAD1, true, true) → text1LaTeX(MAD2, true, true) → text2Remove(left, right) → l1Remove(left, l1) → l2DotPlot(l2, false, 0.2) → l3Length(l2) → e
AI Drawing Prompt Reference
Create a visualization comparing two distributions, each represented by 100 random sample points shown as dot plots with overlaid box plots. The left distribution has fixed parameters, while the right one is adjustable via a slider. Display the mean absolute deviation (MAD) values for both distributions as text labels. Include geometric elements like equilateral triangles and reflections to highlight the overlap region. Add interactive buttons to explore when the overlap becomes too large to distinguish the distributions. The layout should include dot plots, box plots, dynamic text, and controls for adjusting parameters, helping to illustrate the concept of distribution overlap and statistical comparison.
The prompt above was compiled from the original drawing commands and is for reference only.