
Weighted Average Exploration: Interactive Visualization of Weighted Means
Loading the math board and drawing, please wait…
In collections
Statistics Demonstrations
Statistics Demonstrations
Statistics Demonstrations
Statistics Demonstrations
Statistics Demonstrations
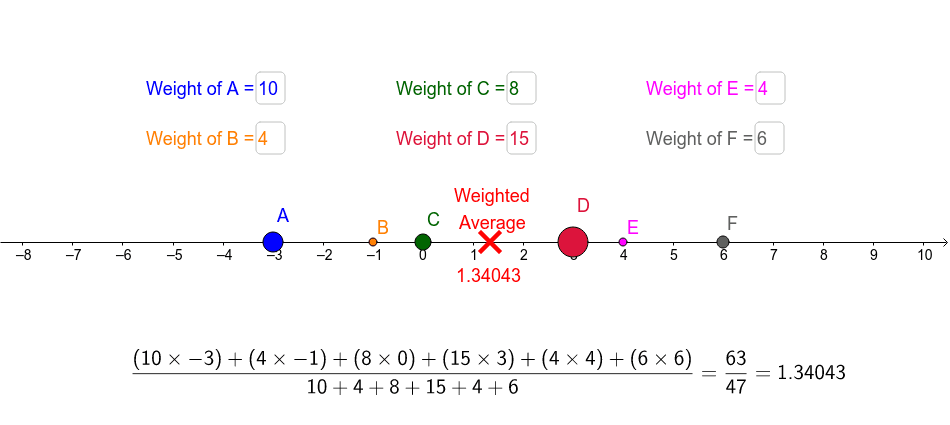
This applet explores weighted averages by letting users adjust the positions of points A, B, C, D, E and their associated weights (WeightA–WeightE) to see how the weighted mean changes in real time. The core mathematics includes the arithmetic weighted mean, linear combinations, and its role in probability distributions such as the hypergeometric and exponential models. The construction uses GeoGebra commands Point, Textfield, and FractionText to create the points and input fields, Slider objects for the weights, and Text objects to display intermediate and final results. It is intended for high‑school or early‑university students studying statistics, probability, and data analysis, and serves as an interactive tool for inquiry‑based learning.
GeoGebra Commands & Parameters
Point(xAxis) → APoint(xAxis) → BPoint(xAxis) → CPoint(xAxis) → DPoint(xAxis) → ETextfield(a) → WeightATextfield(b) → WeightBTextfield(c) → WeightCTextfield(d) → WeightDTextfield(e) → WeightEPoint(xAxis) → FTextfield(f) → WeightFFractionText(x(G)) → xg
AI Drawing Prompt Reference
Place five draggable points on the x-axis, each representing a data value, with an adjacent input field for its weight. Add an additional point whose x-coordinate is the weighted average of the five points, computed as the sum of each point's coordinate times its weight divided by the total weight. Display a fraction text showing this weighted average value. The layout should clearly show the dynamic relationship between the data points, weight inputs, and the resulting average, allowing interactive exploration.
The prompt above was compiled from the original drawing commands and is for reference only.