
Wage Problem
Loading the math board and drawing, please wait…
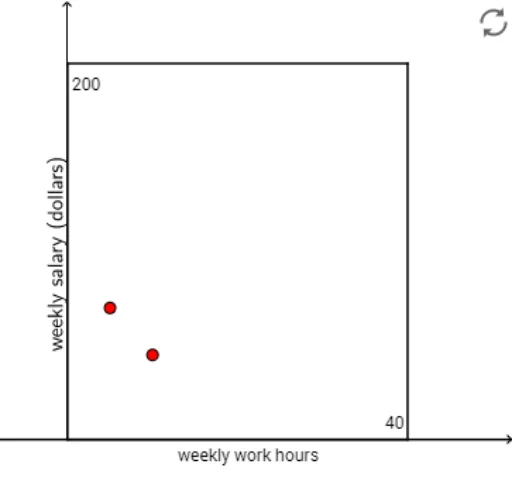
This example uses vectors and polygons to demonstrate a wage problem. Key math concepts include vectors and polygons. GeoGebra commands used include If, RotateText, Textfield, TableText, and Polygon. Suitable for high school math education.
GeoGebra Commands & Parameters
If(t > 0, t, 0) → t_3If(t_1 < 40, t_1, 40) → t_2RotateText("weekly salary (dollars)", 90°) → text4Textfield(b) → InputBox1Textfield(c) → InputBox2Textfield(d) → InputBox3Textfield(e) → InputBox4Textfield(b_1) → InputBox5Textfield(c_1) → InputBox6Textfield(d_1) → InputBox7Textfield(e_1) → InputBox8If(t_3 < 40, t_3, 40) → t_4If(t_1 < 0, 0, t_1) → t_5If(m_1 < 0, q, p) → f_1TableText({{t_6, t_7}, {A8, B8}, {A9, B9}, {A10, B10}, {A11, B11}, {A12, B12}, {A13, B13}, {A14, B14}, {A15, B15}, {A16, B16}, {A17, B17}}, "|_r") → text5Textfield(g) → InputBox9Polygon((0, 0), (0, 200), (40, 200), (40, 0)) → poly1, h, i, j, r
AI Drawing Prompt Reference
Create a diagram for a wage problem: draw a rectangle with horizontal axis from 0 to 40 hours and vertical axis from 0 to 200 dollars. Inside or beside the rectangle, use vectors or arrows to show wage changes for different work periods, and use polygons to fill areas representing regular or overtime pay. Add a rotated text label 'weekly salary (dollars)' along the vertical axis. Place several input boxes around the diagram for entering parameters like hours and wage rates, and include a table showing computed results for various cases. The layout should be clear for educational demonstration.
The prompt above was compiled from the original drawing commands and is for reference only.