
Volumes of exp(x)
Loading the math board and drawing, please wait…
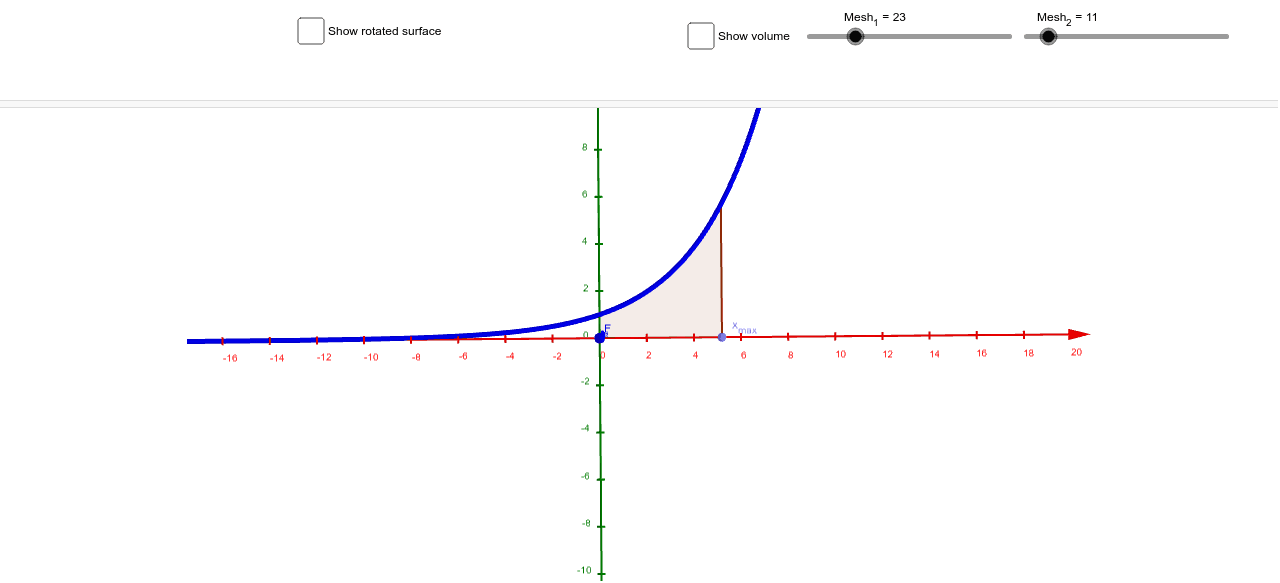
This example demonstrates the calculation of the volume generated by rotating the exponential function y=exp(x). Key math concepts include integration, solid of revolution, and function graphing. GeoGebra commands used in construction are Intersect, Point, Line, Circle, Angle, CurveCartesian, Sequence, Append, Polygon, and Rotate. Suitable for high school and above students learning calculus and solid geometry.
GeoGebra Commands & Parameters
Intersect(yAxis, zAxis) → APoint(xAxis) → BLine(A, B) → aCircle(a, C) → cPoint(c) → DPoint(a) → EAngle(C, A, D) → αCurveCartesian(t, (f(t) * cos(α)), (f(t) * sin(α)), t, 0, x(E)) → bSequence(Circle[((q * x(E) / Mesh_2), 0, 0), f((q * x(E) / Mesh_2)), x + (0 * z) = 0], q, 0, Mesh_2) → list2Sequence(CurveCartesian[t, (f(t) * cos(((2 * π) * q / Mesh_1))), (f(t) * sin(((2 * π) * q / Mesh_1))), t, 0, x(E)], q, 1, Mesh_1) → list1Append((x(E), 0), Append[(0, 0), Sequence[((x(E) * q / n_{points}), f((x(E) * q / n_{points}))), q, 0, n_{points}]]) → liste1Polygon(liste1) → poly1Rotate(poly1, α, a) → poly1'
AI Drawing Prompt Reference
Draw the solid of revolution formed by rotating the function y=exp(x) around the x-axis to demonstrate volume calculation. Start by plotting the intersection of the x and y axes, then draw a line from the x-axis to the y-axis. Use this line segment as a chord to draw a circle, and select a point on the circle. Next, draw a curve along the x-axis starting from the circle's center, representing the function graph. Finally, create the lateral surface of the solid by rotating multiple circular arcs and curve segments around the x-axis, and complete the solid by adding the top and bottom faces.
The prompt above was compiled from the original drawing commands and is for reference only.