
Volume and Power Function Scatter Plot Analysis
Loading the math board and drawing, please wait…
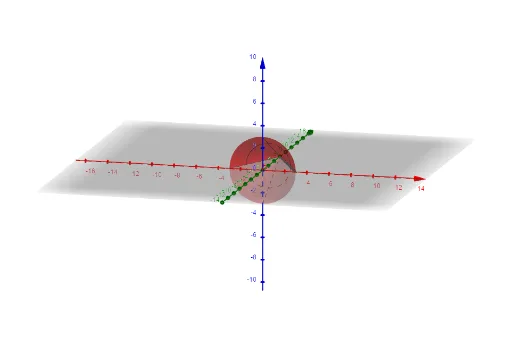
This example demonstrates the relationship between volume and power functions through scatter plots, exploring statistical characteristics. Core math concepts include power functions, scatter plots, statistical features, parametric curves, and equilateral triangles. GeoGebra commands like Surface, f, n, a, b are used in construction. Suitable for high school and above learners to understand the integration of function graphs and data statistics.
GeoGebra Commands & Parameters
Surface(f, n, xAxis) → aSurface(f, n, yAxis) → b