
Visualizing the Magnitude of a Vector
Loading the math board and drawing, please wait…
In collections
Modeling Vectors
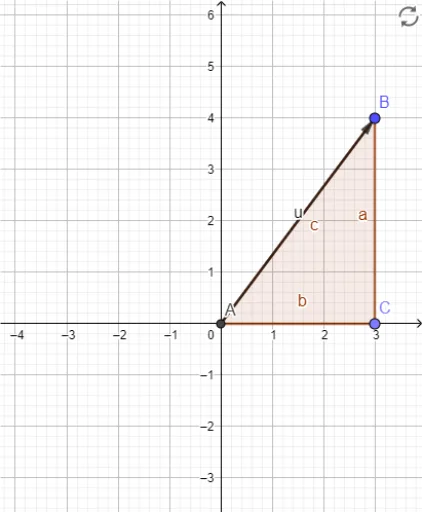
① This GeoGebra example dynamically demonstrates the magnitude (length) of a vector from its initial point to its terminal point, showing the geometric meaning of vector size in relation to its coordinates. ② The core mathematical concept is the Euclidean norm of a vector in 2D, calculated as √(x²+y²), involving vector coordinates, points, and line segments. ③ Construction highlights: using GeoGebra's Point tool to create points A and B, the Vector command to construct vector u, the Intersect command to find intersection points, and the Polygon command to build auxiliary polygons (e.g., right triangles) to aid understanding of the geometric projection of magnitude; objects include A, B, u, C, t1, c, a, b, where a and b may represent coordinate components or side lengths. ④ Suitable for high school or early college students, this example serves as an introductory vector lesson or a classroom demonstration tool, helping learners connect geometric intuition with algebraic formulas.
GeoGebra Commands & Parameters
Intersect(xAxis, yAxis) → AVector(A, B) → uPoint(xAxis) → CPolygon(A, B, C) → t1, c, a, b
AI Drawing Prompt Reference
Draw a coordinate plane with a vector starting at the origin and ending at a movable point. From the endpoint, drop a perpendicular line to the x-axis, creating a right triangle. The triangle's legs represent the vector's horizontal and vertical components, while the hypotenuse is the vector itself. Highlight the vector and label its length to show the Pythagorean relationship between the magnitude and components.
The prompt above was compiled from the original drawing commands and is for reference only.