
Visualizing the Generation of Sine and Cosine Graphs
Loading the math board and drawing, please wait…
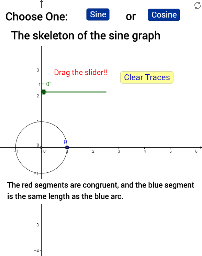
①This example dynamically demonstrates how the graphs of sine and cosine functions are generated from a point moving on the unit circle, making the relationship between angle and function value visually explicit. ②Core mathematical concepts include the unit circle, trigonometric functions (sine and cosine), angle measure in radians, and the periodic nature of these functions. ③Construction highlights: using GeoGebra commands such as Circle to create the unit circle, Rotate and Intersect to define the moving point on the circle, Segment and CircumcircleArc to connect geometric elements, and Angle to label the angle, ultimately producing the sine and cosine curves. ④It is suitable for high school students learning trigonometric graphs and properties, as well as for pre-calculus courses, providing an intuitive geometric foundation for understanding trigonometric functions.
GeoGebra Commands & Parameters
Intersect(xAxis, yAxis) → ACircle(A, B) → cRotate(B, r, A) → PSegment(P, E) → fSegment(D, C) → hRotate(B, r / 2, A) → B'_1CircumcircleArc(B, B'_1, P) → dSegment(A, D) → iSegment(P, A) → jRotate(B, r, A) → B'Angle(B, A, B') → αCircle(A, 1) → e
AI Drawing Prompt Reference
Draw a unit circle and dynamically move a point on it to show the angle α between the point and the positive x-axis, and draw a line segment from the origin to the point, as well as an arc from the point to another point on the circle, ultimately generating the sine and cosine curves.
The prompt above was compiled from the original drawing commands and is for reference only.