
Visualizing the Derivative of Exponential Functions
Loading the math board and drawing, please wait…
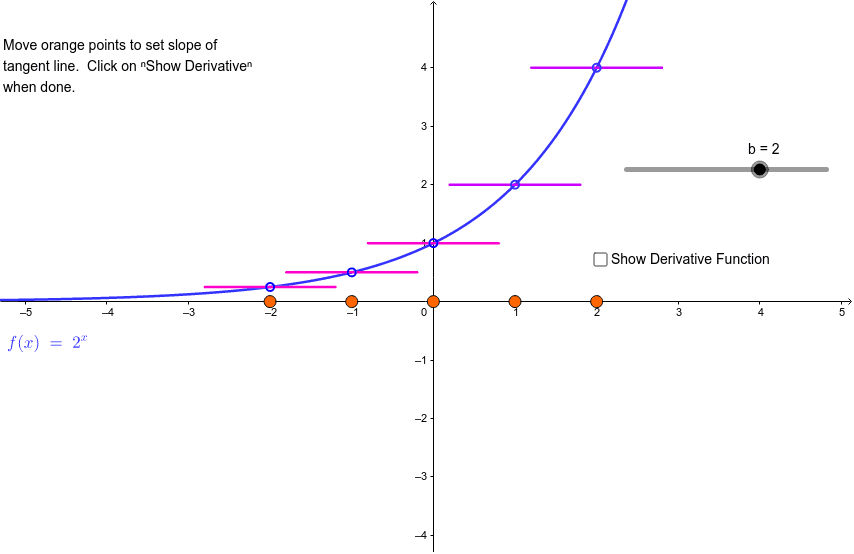
This GeoGebra example dynamically illustrates the derivative of exponential functions, showing that the derivative of an exponential function is itself multiplied by a constant. It highlights the geometric interpretation of the derivative as the slope of the tangent line, and involves core concepts such as exponential functions, derivatives, tangent lines, vectors, and matrices. The construction uses commands like Point, Circle, Intersect, Segment, and Derivative, with objects including multiple points (A, B, C, etc.), the function f and its derivative f', and auxiliary segments and vectors. Suitable for high school and college calculus courses, this example helps students understand the definition of the derivative, the relationship between tangent slope and rate of change, and how different bases affect the derivative of exponential functions.
GeoGebra Commands & Parameters
Point(e) → ACircle(B, 0.8) → kIntersect(j, k, 1) → CIntersect(j, k, 2) → DSegment(C, D) → lDerivative(f) → f'Point(h) → ECircle(F, 0.8) → qIntersect(p, q, 1) → GIntersect(p, q, 2) → HSegment(G, H) → nPoint(g) → ICircle(J, 0.8) → sIntersect(r, s, 1) → MIntersect(r, s, 2) → NSegment(M, N) → tPoint(i) → KCircle(L, 0.8) → c_1Intersect(f_1, c_1, 1) → OIntersect(f_1, c_1, 2) → PSegment(O, P) → a_1Point(b_1) → QCircle(R, 0.8) → k_1Intersect(p_1, k_1, 1) → SIntersect(p_1, k_1, 2) → TSegment(S, T) → i_1Point(d_1) → UCircle(V, 0.8) → r_1Intersect(q_1, r_1, 2) → WIntersect(q_1, r_1, 1) → ZSegment(Z, W) → j_1Point(e_1) → A_1Circle(B_1, 0.8) → t_1Intersect(s_1, t_1, 2) → C_1Intersect(s_1, t_1, 1) → D_1Segment(D_1, C_1) → l_1Point(g_1) → E_1Circle(F_1, 0.8) → c_2Intersect(f_2, c_2, 1) → G_1Intersect(f_2, c_2, 2) → H_1Segment(G_1, H_1) → m_1Point(h_1) → I_1Circle(J_1, 0.8) → d_2Intersect(g_2, d_2, 1) → K_1Intersect(g_2, d_2, 2) → L_1Segment(K_1, L_1) → n_1
AI Drawing Prompt Reference
Draw the graph of an exponential function f(x) and its derivative f'(x). First, plot the exponential function f(x). Then, select two points A and B on f(x) and draw the tangent line l through A and B. Next, plot the derivative f'(x) and select a point E on f'(x), then draw the tangent line n through E. Finally, use the intersection points of f(x) and f'(x), as well as the intersection points of l and n, to construct auxiliary line segments, illustrating the relationship between the derivative and the original function.
The prompt above was compiled from the original drawing commands and is for reference only.