
Problem 4: Graphing Rectangles
Loading the math board and drawing, please wait…
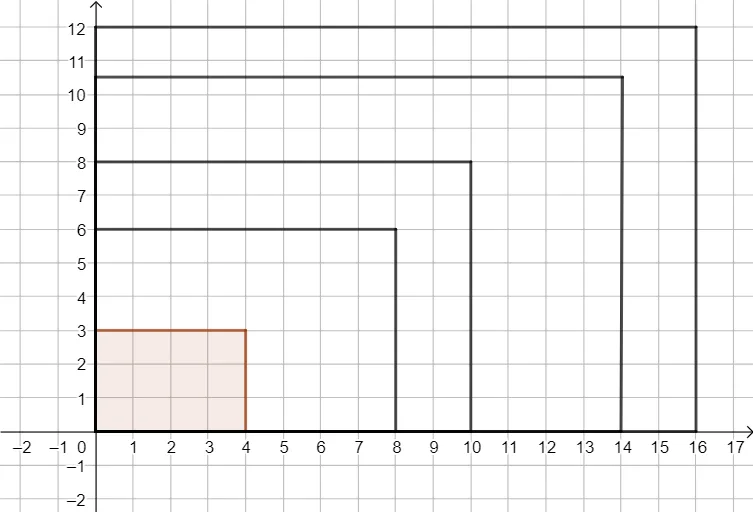
This example demonstrates how to graph a series of rectangles in GeoGebra and explore the relationships between geometry and functions. The core mathematical concepts include properties of rectangles, similar triangles, centroid (barycenter), and exponential functions. The construction uses the Intersect command to find intersection points, Point to define key vertices, and Polygon to form the rectangles; objects include multiple points (A through P) and rectangles (q1 to q5), along with auxiliary segments and variables. It is suitable for middle and high school students learning geometric construction, ratios, and function graphing, and helps visualize how rectangle areas can relate to exponential growth.
GeoGebra Commands & Parameters
Intersect(xAxis, yAxis) → APoint(yAxis) → BPoint(xAxis) → DPolygon(A, B, C, D) → q1, a, b, c, dPoint(xAxis) → EPoint(yAxis) → GPolygon(E, F, G, A) → q2, e, f, g, a_1Point(xAxis) → HPoint(yAxis) → JPolygon(H, I, J, A) → q3, h, i, j, a_2Point(xAxis) → KPoint(yAxis) → MPolygon(K, L, M, A) → q4, k, l, m, a_3Point(xAxis) → NPoint(yAxis) → PPolygon(N, O, P, A) → q5, n, o, p, a_4
AI Drawing Prompt Reference
Draw a set of five nested rectangles on a coordinate plane, all sharing the origin as a common vertex. Each rectangle has one side along the x-axis and one side along the y-axis, with the origin as the lower-left corner. The first rectangle is defined by points on the axes, and each subsequent rectangle uses new points on the axes, expanding outward. All rectangles are aligned with the axes and share the origin.
The prompt above was compiled from the original drawing commands and is for reference only.