
Empirical vs. Theoretical Probability Comparison
Loading the math board and drawing, please wait…
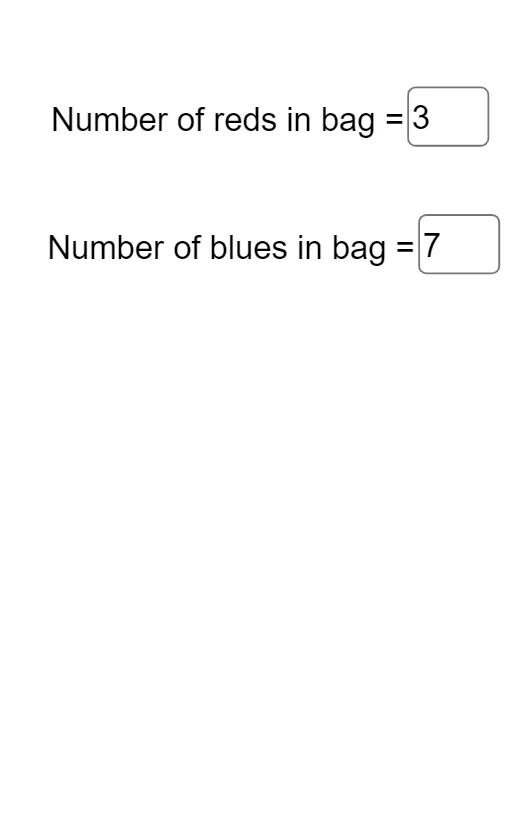
①This example demonstrates the difference and convergence between empirical probability (based on actual trial outcomes) and theoretical probability (based on mathematical formulas) through random binomial experiments. ②Core mathematical concepts include probability, binomial distribution, random trials, law of large numbers, and the relationship between empirical frequency and theoretical probability. ③Construction highlights: The RandomBinomial command generates random binomial data, Textfield input boxes (InputBox1, InputBox2) allow adjusting the number of trials and success probability, and multiple objects (A1 to A31, B1 to B5) store and compute empirical frequencies and theoretical probabilities, displayed graphically or numerically for comparison. ④Suitable for high school or college probability and statistics courses, helping students understand randomness, frequency stability, and the intuitive meaning of the law of large numbers, and can be used as an exploratory learning tool.
GeoGebra Commands & Parameters
Textfield(r) → InputBox1Textfield(b) → InputBox2RandomBinomial(10, 0.3) → B2RandomBinomial(10, 0.3) → B3RandomBinomial(10, 0.3) → B4RandomBinomial(10, 0.3) → B5RandomBinomial(10, 0.3) → B6RandomBinomial(10, 0.3) → B7RandomBinomial(10, 0.3) → B8RandomBinomial(10, 0.3) → B9RandomBinomial(10, 0.3) → B10RandomBinomial(10, 0.3) → B11RandomBinomial(10, 0.3) → B12RandomBinomial(10, 0.3) → B13RandomBinomial(10, 0.3) → B14RandomBinomial(10, 0.3) → B15RandomBinomial(10, 0.3) → B16RandomBinomial(10, 0.3) → B17RandomBinomial(10, 0.3) → B18RandomBinomial(10, 0.3) → B19RandomBinomial(10, 0.3) → B20RandomBinomial(10, 0.3) → B21RandomBinomial(10, 0.3) → B22RandomBinomial(10, 0.3) → B23RandomBinomial(10, 0.3) → B24RandomBinomial(10, 0.3) → B25RandomBinomial(10, 0.3) → B26RandomBinomial(10, 0.3) → B27RandomBinomial(10, 0.3) → B28RandomBinomial(10, 0.3) → B29RandomBinomial(10, 0.3) → B30RandomBinomial(10, 0.3) → B31
AI Drawing Prompt Reference
Create a graph comparing empirical and theoretical probabilities using random binomial experiments. Include input boxes to adjust the number of trials and success probability. Display multiple sets of randomly generated binomial data along with their corresponding empirical frequencies and theoretical probabilities, visually comparing them to illustrate randomness, frequency stability, and the law of large numbers.
The prompt above was compiled from the original drawing commands and is for reference only.