
Visualizing Square Areas & Square Roots
Loading the math board and drawing, please wait…
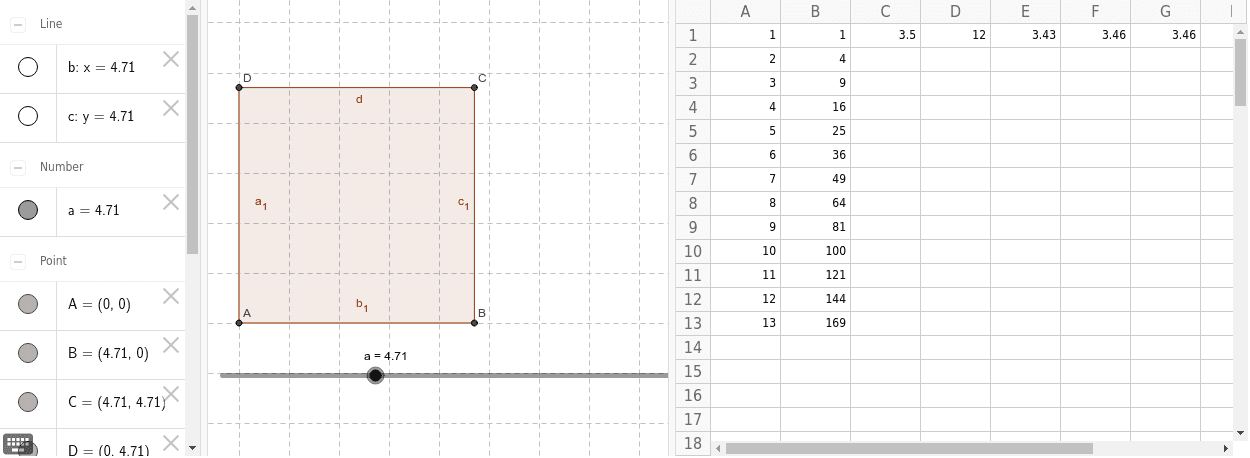
This example dynamically demonstrates the relationship between the area of a square and its side being the square root of the area. It involves core math concepts like area calculation, square roots, and geometric visualization. GeoGebra commands used include Intersect, OrthogonalLine, and Polygon for constructing the visual representation. Suitable for middle school students and above to understand the geometric meaning of square roots and the construction of function graphs.
GeoGebra Commands & Parameters
Intersect(xAxis, yAxis) → AOrthogonalLine(B, xAxis) → bOrthogonalLine(C, b) → cIntersect(c, yAxis) → DPolygon(A, D, C, B) → poly1, a_1, d, c_1, b_1
AI Drawing Prompt Reference
Draw a dynamic visualization showing the relationship between a square's area and its side being the square root of the area, including coordinate axes, a square, and line segments representing the square root of its sides, demonstrating how the area changes with the side length and the geometric meaning of the square root of the area, start by plotting the intersection of axes, then construct perpendicular lines to form the square, and finally connect the vertices to complete the shape.
The prompt above was compiled from the original drawing commands and is for reference only.