
Visualizing Percentages by Lee W Fisher
Loading the math board and drawing, please wait…
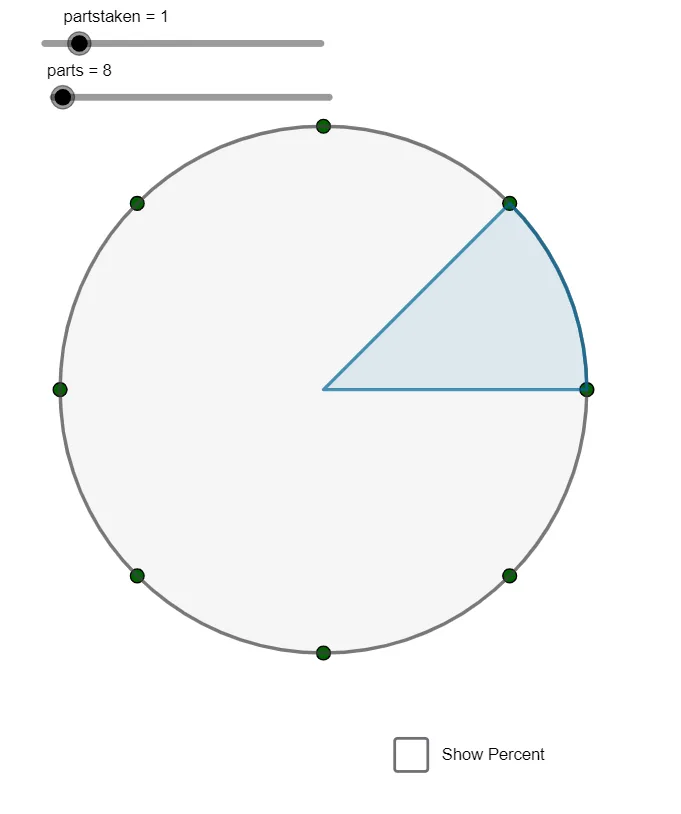
This example visually demonstrates the concept of percentages using fractions and circular sectors. It utilizes GeoGebra commands such as Sequence and CircleSector to dynamically show how percentages are distributed in a circle. Suitable for middle school and above students to learn probability and geometry.
GeoGebra Commands & Parameters
Sequence((cos(((n * 2) * pi / parts)), sin(((n * 2) * pi / parts))), n, 1, parts) → l1CircleSector((0, 0), (1, 0), (cos(((partstaken * 2) * pi / parts)), sin(((partstaken * 2) * pi / parts)))) → eSequence((cos(((m * 2) * pi / 100)), sin(((m * 2) * pi / 100))), m, 0, 100) → l2CircleSector((0, 0), (1, 0), (cos(((partstaken * 2) * pi / parts)), sin(((partstaken * 2) * pi / parts)))) → f