
Visualizing Integer Addition on the Number Line by GeoGebra Team
Loading the math board and drawing, please wait…
In collections
Learn GeoGebra Classic
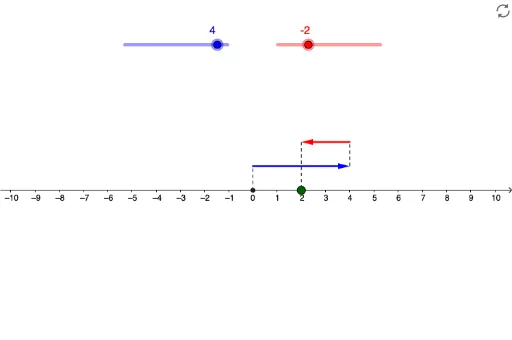
① This example creates a dynamic number-line figure that visually demonstrates integer addition, showing how positive and negative numbers move left or right and combine to yield a sum. ② The core mathematical concepts are integer addition, directed distance on a number line, the meaning of positive and negative numbers, and the commutative property of addition. ③ Construction highlights: using GeoGebra's Vector command to create vectors (u, v) representing the addends, Segment command to draw line segments on the number line, with objects a and b as the addends, points A and B as initial positions, C and D as translated positions, R as the result point, Z as zero, and auxiliary segments c, d, e for labels or guides. Sliders or input boxes allow dynamic adjustment of a and b, placing vectors head-to-tail to reveal the final coordinate. ④ Suitable for upper elementary through middle school students learning rational number operations, and for teachers demonstrating how algebraic rules emerge from geometric intuition, reducing reliance on rote memorization.
GeoGebra Commands & Parameters
Vector(A, B) → uVector(C, D) → vSegment(Z, A) → cSegment(B, C) → dSegment(D, R) → e
AI Drawing Prompt Reference
Create a dynamic number line to visualize integer addition. Use two vectors to represent two integers, connecting their tails to show the addition process. The vectors start from zero and point to the positions corresponding to the absolute values of the integers. Adjust the integers dynamically to see how the sum moves along the number line.
The prompt above was compiled from the original drawing commands and is for reference only.