
Quadratic Functions Anatomy (2): Slopes, Vectors, and Geometric Insight
Loading the math board and drawing, please wait…
In collections
Quadratic Functions Anatomy and Transformations
Transforming Quadratic Function Graphs
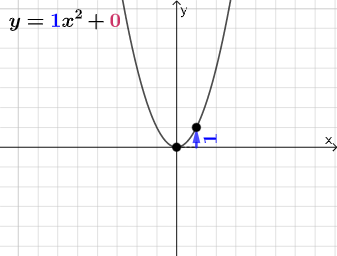
This GeoGebra example provides an in-depth visual dissection of a quadratic function y = ax² + bx + c, focusing on the slope (rise/run) between two points on the curve, the associated secant vector, and the geometric elements such as triangles and polygons built around the graph. Core mathematical concepts include the standard form of quadratic functions, increasing/decreasing behavior, slope and difference quotient, vector representation, and the Pythagorean theorem for distance calculations. Construction highlights: using GeoGebra commands like Point, Line, Segment, Vector, Polygon, and RotateText, the example creates points A, B, C, D and the function f, with text objects labeling parameters a, b, c and slope values. Dynamic sliders or draggable points allow real-time exploration of how changing coefficients affects the parabola's shape and the slope between points. This resource is ideal for high school students learning quadratic functions, analytic geometry, and rates of change, as well as for teachers demonstrating the algebraic-geometric connection in a classroom setting.
GeoGebra Commands & Parameters
Point(x = 0) → APoint(Segment[(1, y(C) + 10), (1, y(C) - 10)]) → DLine(A, B) → fVector(A, C) → uPolygon(A, C, B) → t1, b, a_1, cRotateText(text2, π / 2) → text3Vector((0, 0), A) → wSegment(A, C) → hVector(C, D) → v
AI Drawing Prompt Reference
Draw a parabola y = ax² + bx + c with points A, B, C, D. Show vector u from A to C, vector w from origin to A, and segment h between A and C. Include vector v from C to D. Add triangles and text labels to explain slope, vectors, and geometric relationships.
The prompt above was compiled from the original drawing commands and is for reference only.