
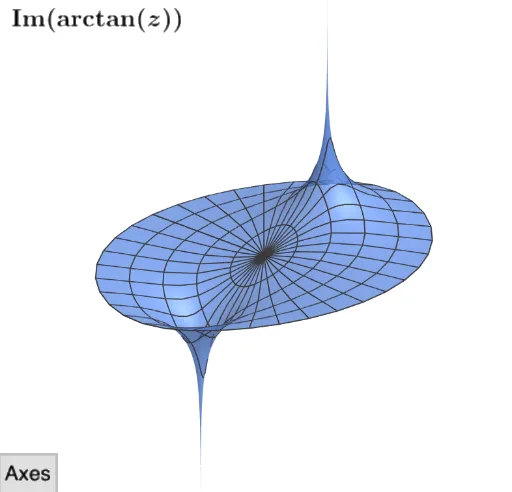
Visualizing Imaginary Component: arctan(z)
Loading the math board and drawing, please wait…
This example demonstrates the visualization of the imaginary component arctan(z) of a complex number z in 3D space. Key math concepts include complex numbers, trigonometric functions, analytical geometry, and 3D surfaces. Construction highlights the use of commands like Surface, SelectedIndex, button1, t, a, b, c, text1, f, g, Im, ListBranches, index, RSIm, text2 in GeoGebra. Suitable for high school and above learners to understand the geometric representation and visualization of complex function graphs.
GeoGebra Commands & Parameters
SelectedIndex(ListBranches) → indexSurface((u * cos(v)), (u * sin(v)), (0 * (1 - t / 2)) + (Im((u * cos(v)), (u * sin(v))) * t / 2), u, 0, 2, v, (-π), π - π / 1000) → RSIm