
Visualizing Fractions: Circles and Sequences for Numerator-Denominator
Loading the math board and drawing, please wait…
In collections
Learn GeoGebra Classic
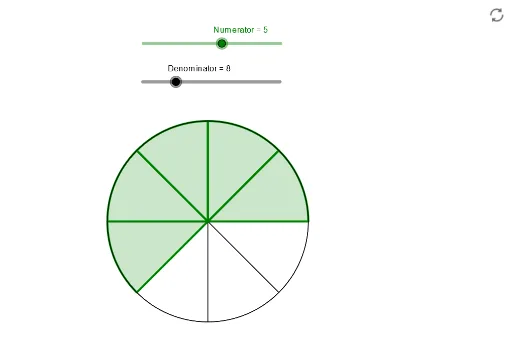
① This GeoGebra example dynamically visualizes fractions by partitioning circles and using sequences to show the relationship between numerators and denominators. ② Core mathematical concepts include fractions, ratios, unit circle division, and sequence generation, helping learners grasp part-whole relationships. ③ Construction highlights: the Circle command creates the base circle, Sequence generates division points or sectors, with objects like Numerator, Denominator, and slider α controlling the number of parts for interactive exploration. ④ Suitable for upper elementary to middle school students learning fraction basics, and useful for classroom demonstrations or self-study to strengthen visual-spatial understanding of numbers.
GeoGebra Commands & Parameters
Circle(A, r) → cSequence(CircleSector[A, ((r * cos((α * (i - 1)))), (r * sin((α * (i - 1))))), ((r * cos((α * i))), (r * sin((α * i))))], i, 1, Denominator) → Liste1Sequence(CircleSector[A, ((r * cos((α * (i - 1)))), (r * sin((α * (i - 1))))), ((r * cos((α * i))), (r * sin((α * i))))], i, 1, Numerator) → Liste2