
Pie Fraction Creator: Dynamic Sector Division and Ratio Visualization
Loading the math board and drawing, please wait…
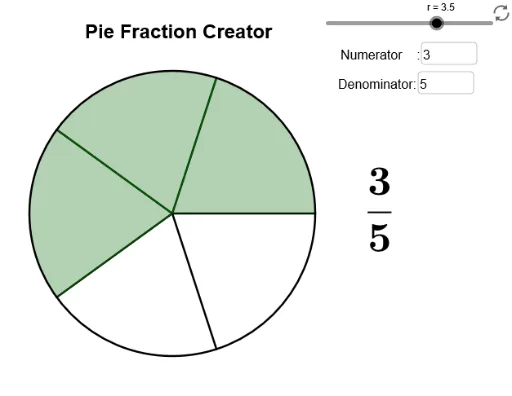
① This example demonstrates how to create an interactive pie chart (sector diagram) in GeoGebra, where users can adjust input values to change the number and size of sectors, visually showing how a whole is divided into proportional parts. ② Core mathematical concepts include circle geometry, the relationship between sector area and central angle, fractions and ratios visualization, and using sequences to generate multiple objects. ③ Construction highlights: using GeoGebra commands Sequence, Segment, Circle, and Textfield, it creates point A, radius r, count n, point list ptList1, segment list segList, radius list radiiList, circle_1, sector list sectorList, and uses InputBox1 and InputBox2 to control parameters, with text1 and text2 displaying values. ④ Suitable for middle school mathematics (e.g., grades 6-9) to learn fractions, ratios, circles, and sectors, and also useful for elementary math demonstrations or teacher-created interactive lessons to help students understand part-whole relationships.
GeoGebra Commands & Parameters
Sequence(Rotate[A + (r, 0), ((k * 2) * π / n), A], k, 0, n) → ptList1Sequence(Segment[Element[ptList1, k], Element[ptList1, k + 1]], k, 1, n) → segListSegment(A, A + (r, 0)) → radius_1Sequence(Rotate[radius_1, (360° * k / n), A], k, 1, n) → radiiListCircle(A, r) → circle_1Sequence(Sector[circle_1, Element[ptList1, k], Element[ptList1, k + 1]], k, 1, m) → sectorListTextfield(m) → InputBox1Textfield(n) → InputBox2
AI Drawing Prompt Reference
Create an interactive pie chart where users can adjust two parameters to change the number and size of sectors, visually showing how a whole is divided into proportional parts. The center is a circle with multiple radii extending from the center, dividing the circle into several sectors. Use sliders to control the number of sectors and the radius, with the size and angle of each sector proportional to the parameters. Display values inside and next to each sector to help understand the proportion each sector represents.
The prompt above was compiled from the original drawing commands and is for reference only.