
Different Views of the Same Fraction
Loading the math board and drawing, please wait…
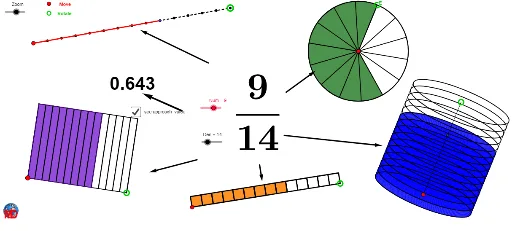
This example demonstrates different representations of the same fraction. It involves key concepts such as fractions, vectors, and geometric construction. Using GeoGebra commands like Circle, Point, Segment, and Intersect, various representations of the fraction can be constructed. Suitable for middle school and above students or teachers.
GeoGebra Commands & Parameters
Circle(D, Zoom) → d_1Circle(D, (0.25 * Zoom)) → tCircle(D, (2 * Zoom)) → pPoint(p) → MSegment(D, M) → lIntersect(t, l) → Q,OrthogonalLine(D, l) → nIntersect(d_1, n) → N, OEllipse(N, O, Q) → bCircle(C, (2 * Zoom)) → qCircle(J, (3 * Zoom)) → kCircle(B, (4 * Zoom)) → fCircle(A, Zoom) → ePoint(e) → EPoint(f) → FSequence(Rotate[E, i, A], i, 0, 6.283185307179586, (2 * π / Den)) → liste1Sequence(Translate[B, Vector[(i * Vector[B, F])]], i, 0, 1, 1 / Den) → liste2Point(k) → KCurveCartesian(x(D) + (Zoom * cos(i)), y(D) + ((0.25 * Zoom) * sin(i)), i, 0, 6.28319) → b_1Sequence(Translate[J, Vector[(i * Vector[J, K])]], i, 0, 1, 1 / Den) → liste3Segment(B, F) → cCircle(A, E) → dSequence(Translate[b, Vector[(i * Vector[D, M])]], i, 0, 1, 1 / Den) → liste5Point(q) → GSegment(J, K) → jSequence(Polygon[Element[liste3, i], Element[liste3, i + 1], 4], i, 1, Length[liste3]) → liste3bSegment(C, G) → gOrthogonalLine(C, g) → hCircle(C, (1.5 * Zoom)) → sIntersect(s, h) → H, LLine(L, g) → iLine(G, h) → mIntersect(i, m) → IPolygon(C, G, I, L) → poly1, c_1, g_1, i_1, l_1Sequence(Translate[C, Vector[(i * Vector[C, G])]], i, 0, 1, 1 / Den) → liste4Sequence(Translate[L, Vector[(i * Vector[C, G])]], i, 0, 1, 1 / Den) → liste6Sequence(Segment[A, Element[liste1, i]], i, 1, Length[liste1]) → liste7Sequence(Segment[Element[liste4, i], Element[liste6, i]], i, 1, Length[liste6]) → liste8Element(liste1, Num + 1) → AACircleSector(A, E, AA) → e_1Element(liste2, Num + 1) → BBSegment(B, BB) → a_1Take(liste5, 1, Num + 1) → liste9Element(liste4, Num + 1) → CCElement(liste6, Num + 1) → LLPolygon(C, CC, LL, L) → poly2, c_2, cc, ll, l_2Take(liste3b, 1, Num) → liste10Line(M, n) → f_1Intersect(b, n) → P, RLine(R, l) → h_1Line(P, h_1) → j_1Intersect(f_1, h_1) → SIntersect(f_1, j_1) → TSegment(S, R) → k_1Segment(T, P) → m_1Vector(V, W) → uVector(Z, A_1) → vVector(B_1, C_1) → wVector(D_1, E_1) → zVector(F_1, G_1) → rCircle(D, pp) → p_1Intersect(p_1, l) → J_1,Sequence(Translate[b, Vector[(i * Vector[D, J_1])]], i, 0, 1, 0.01) → liste11Vector(K_1, L_1) → u_1
AI Drawing Prompt Reference
Draw a geometric figure illustrating different representations of the same fraction. Start with several concentric circles centered at distinct points, with radii scaled by multiples of the fraction's denominator. Pick a point on the largest circle, connect it to the center to form a segment, intersect this with a smaller circle, and draw a perpendicular line through the center to meet the largest circle at two points, then construct an ellipse through these points and the intersection. On another set of circles, choose points and generate sequences via rotation and translation, connecting them with segments to form polygonal grids. Also construct a rhombus region and translate it repeatedly to create multiple identical shapes. Finally, highlight the fractional part using a sector and segments, showing the fraction in circular, elliptical, and polygonal views.
The prompt above was compiled from the original drawing commands and is for reference only.