
Visualizing Division of Fractions (Non-mixed)
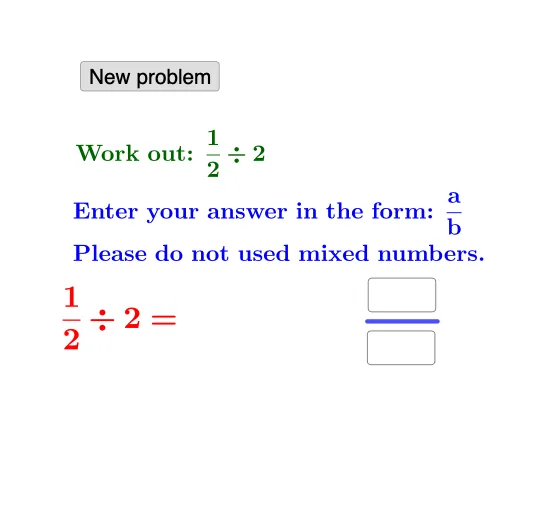
Loading the math board and drawing, please wait…
This GeoGebra example demonstrates the meaning of dividing fractions by linking the division operation to a clear geometric interpretation, helping learners see how the result emerges from structured partitioning. It focuses on the key ideas of fractional representation (numerator and denominator) and the rules of fraction division, reinforced with geometric intuition such as consistent subdivision and (where applicable) symmetry of the constructed figure. Construction-wise, the setup uses Random to generate parameters, Textfield/InputBox for interactive inputs, Numerator and Denominator to extract the fraction parts, Segment to build the geometric objects, and If to select the proper behavior for different cases. FractionText is used to present the resulting fraction in text form, and multiple generated objects (points/values like a, b, c, d, e, f, plus interface elements such as button1) connect the numerical inputs to the displayed geometry and output. Suitable for middle-school to early high-school instruction, classroom demonstrations, and interactive practice on fraction operations.
GeoGebra Commands & Parameters
Random(1, 10) → aRandom(1, 10) → eRandom(1, 10) → dRandom(2, 12) → fRandom(1, 10) → bRandom(b + 1, 12) → cRandom(1, 10) → gRandom(1, 10) → hRandom(h + 1, 12) → iTextfield(k) → InputBox1Numerator(j) → lDenominator(j) → mSegment(A, B) → pTextfield(o) → InputBox2If(l ≟ k ∧ m ≟ o, "Correct!", "Wrong. Try again.") → text2FractionText(q) → text6FractionText(r) → text7
AI Drawing Prompt Reference
Draw a geometric figure illustrating the division of fractions. The figure includes a rectangle divided by two parallel lines into two parts. The left part represents the numerator, and the right part represents the denominator. Users can input values through input boxes to select the numerator and denominator, and the figure will automatically calculate and display the division result. A text box is also included to show the result. The construction order is to first draw the rectangle and dividing lines, then add the input boxes, and finally update the figure and text display based on the input values.
The prompt above was compiled from the original drawing commands and is for reference only.