
Visualizing Column Addition with Norwegian Currency
Loading the math board and drawing, please wait…
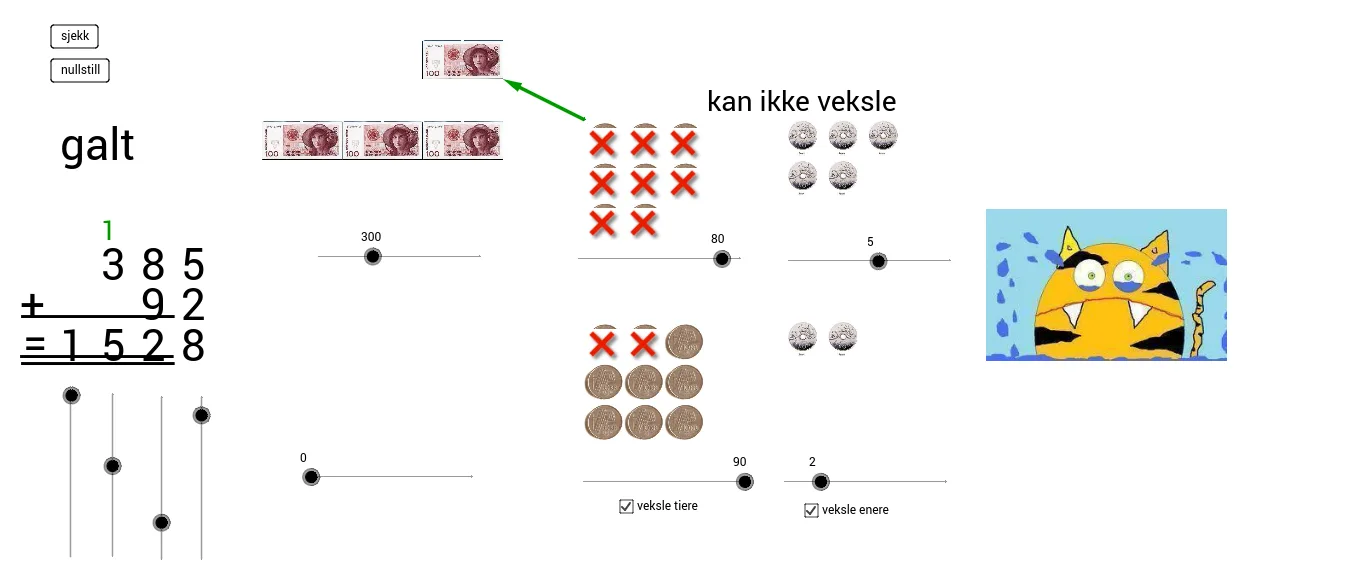
This GeoGebra example visually demonstrates the step-by-step process of column addition using Norwegian currency (kroner), focusing on aligning hundreds, tens, and ones. The core mathematical concepts include the decimal place value system, multi-digit addition alignment rules, and basic financial arithmetic. To construct this visual alignment, the model utilizes the `Vector` command to define precise translations, positioning text labels like 'Hundrere' (hundreds), 'tiere' (tens), and 'enere' (ones) alongside currency images (`bilde1` through `bilde13`). Geometric points (`A, C, E, etc.`) are used to anchor the exact coordinates of each digit and banknote image. This tool is highly suitable for primary school students learning column addition, place value, and practical money counting in arithmetic classes.
GeoGebra Commands & Parameters
Vector(H_3, F_3) → uVector(S_3, R_3) → v
AI Drawing Prompt Reference
Create a visualization of column addition using Norwegian kroner, including 13 currency images (bilde1 to bilde13) aligned by hundreds, tens, and ones. Use the vector command to place the text labels 'hundreds', 'tens', and 'ones' next to the corresponding currency images. Start by adding the currency images, then add the text labels, and finally use the vector command for precise alignment.
The prompt above was compiled from the original drawing commands and is for reference only.