
Statistics Game: Mean, Median, and Variance
Loading the math board and drawing, please wait…
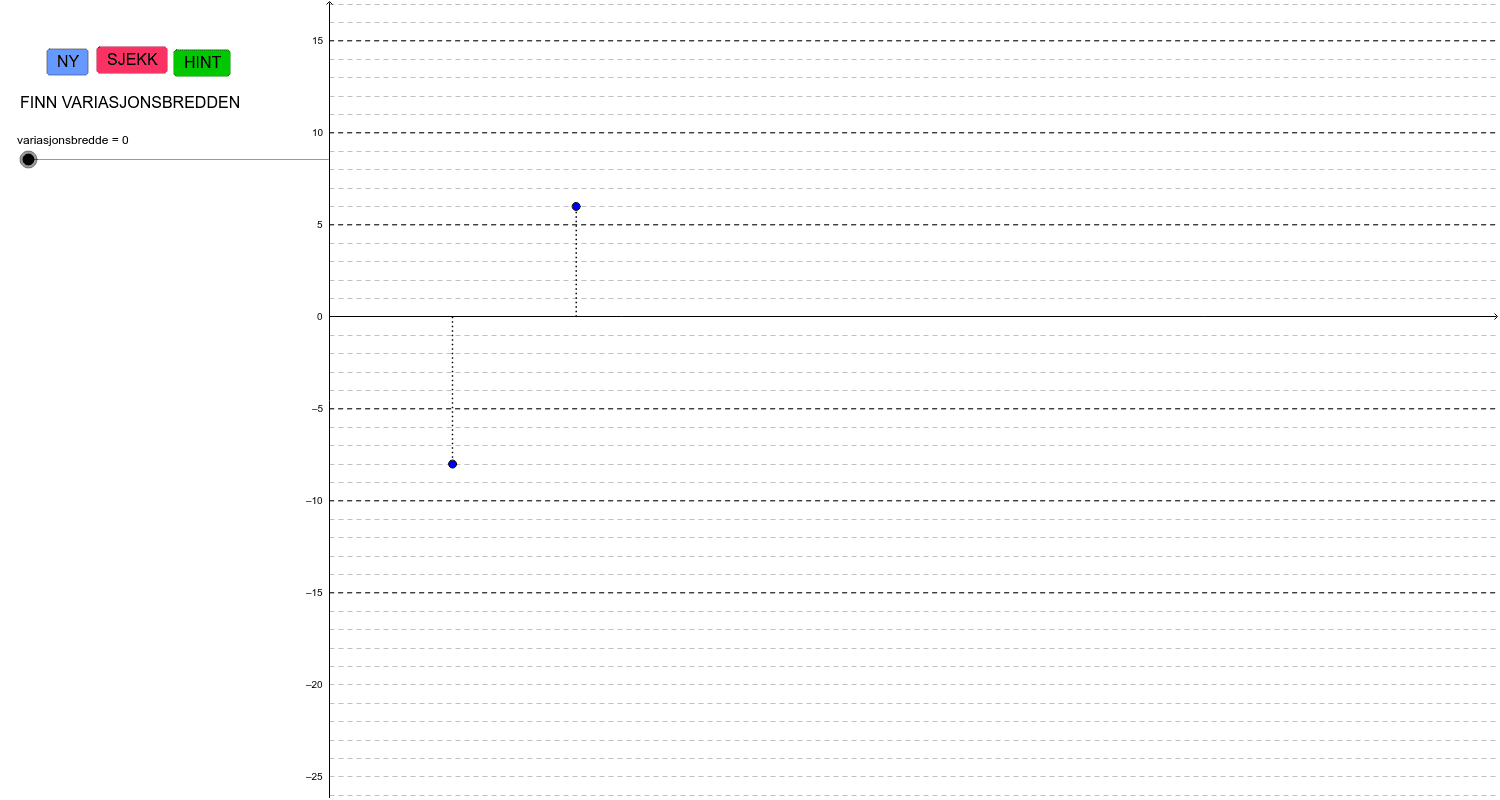
This example uses 60 different sliders to demonstrate how to find the mean, median, or mode of a set of data. It covers core statistical concepts such as mean, median, and mode. Using GeoGebra commands like Point, Segment, Mean, Median, Max, Min, and Mode, it provides a visual understanding of how these statistics are calculated. Suitable for middle school and above students or teachers to help students better understand basic statistical concepts.
GeoGebra Commands & Parameters
Point(xAxis) → BPoint(xAxis) → CPoint(xAxis) → DPoint(xAxis) → EPoint(xAxis) → FSegment(A, G) → hSegment(B, H) → iSegment(C, I) → jSegment(D, J) → kSegment(E, K) → lSegment(F, L) → pMean({a, b}) → oSegment(M, N) → qMean({a, b, c}) → g_3Segment(O, P) → rMean({a, b, c, d}) → g_4Segment(Q, R) → sMean({a, b, c, d, e}) → g_5Segment(S, T) → tMean({a, b, c, d, e, f}) → g_6Segment(U, V) → a_1Median({a, b}) → m_2Median({a, b, c}) → m_3Median({a, b, c, d}) → m_4Median({a, b, c, d, e}) → m_5Median({a, b, c, d, e, f}) → m_6Segment(W, Z) → b_1Segment(A_1, B_1) → c_1Segment(C_1, D_1) → d_1Segment(E_1, F_1) → e_1Segment(G_1, H_1) → f_1Max(a, b) → max_2Min(a, b) → min_2Segment(J_1, I_1) → g_1Max({a, b, c}) → max_3Max({a, b, c, d}) → maxMax({a, b, c, d, e}) → max_5Max({a, b, c, d, e, f}) → max_6Min({a, b, c}) → min_3Min({a, b, c, d}) → min_4Min({a, b, c, d, e}) → min_5Min({a, b, c, d, e, f}) → min_6Segment(L_1, K_1) → h_1Max({a, b, c, d}) → max_4Segment(M_1, N_1) → i_1Segment(O_1, P_1) → j_1Segment(Q_1, R_1) → k_1Mode(Liste5) → Typetall5Max(Typetall5) → Maks5Min(Typetall5) → Min5Segment(T_1, U_1) → l_1Segment(S_1, V_1) → m_1Mode(Liste6) → Typetall6Max(Typetall6) → Maks6Min(Typetall6) → Min6Segment(W_1, A_2) → n_1Segment(B_2, Z_1) → p_1Mode(Liste4) → Typetall4Max(Typetall4) → Maks4Min(Typetall4) → Min4Segment(D_2, E_2) → q_1Segment(F_2, C_2) → r_1Mode(Liste3) → Typetall3Max(Typetall3) → Maks3Segment(G_2, H_2) → s_1Element(Typetall6, 2) → Midt6Segment(I_2, J_2) → t_1Segment(L_2, M_2) → a_2OrthogonalLine(G, a_2) → b_2Intersect(b_2, a_2) → O_2OrthogonalLine(H, a_2) → c_2OrthogonalLine(I, a_2) → d_2OrthogonalLine(J, a_2) → e_2Intersect(c_2, a_2) → P_2Intersect(a_2, e_2) → R_2Intersect(a_2, d_2) → Q_2Segment(G, O_2) → i_2Segment(H, P_2) → j_2Segment(I, Q_2) → k_2Segment(J, R_2) → l_2OrthogonalLine(K, a_2) → n_2OrthogonalLine(L, a_2) → q_2Intersect(n_2, a_2) → S_2Intersect(q_2, a_2) → T_2Segment(K, S_2) → r_2Segment(L, T_2) → s_2Segment(K, S_2) → t_2Segment(L, T_2) → a_3Segment(U_2, V_2) → b_3Point(c_3) → W_2Segment(W_2, Z_2) → d_3Ray(A_3, B_3) → f_2Ray(C_3, D_3) → g_2Ray(E_3, F_3) → e_3Ray(G_3, H_3) → f_3Point(e_3) → I_3Ray(L_3, M_3) → h_3Ray(J_3, K_3) → i_3Point(h_3) → N_3
AI Drawing Prompt Reference
Create six points on the horizontal axis and connect each point to a corresponding vertical line segment to display the mean, median, maximum, and minimum values of a dataset. Use different colors and line styles to distinguish between the mean, median, maximum, and minimum values, and label how changes in dataset size affect these statistics.
The prompt above was compiled from the original drawing commands and is for reference only.