
Visualizing a Function with No Limit at a Point
Loading the math board and drawing, please wait…
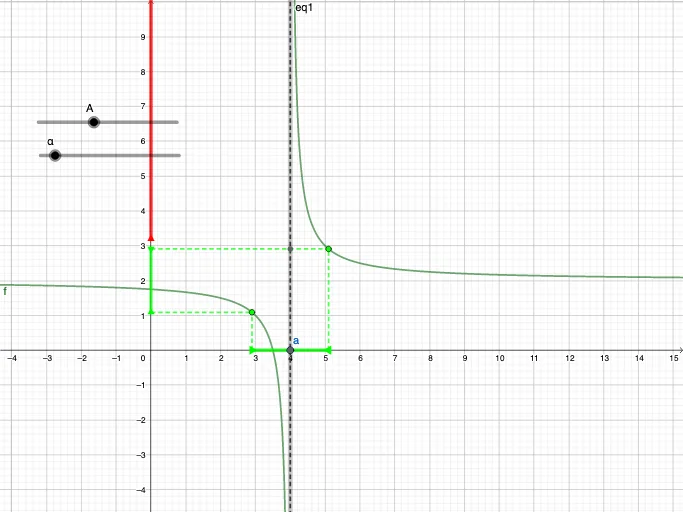
This example demonstrates how a function can fail to have a limit at a specific point, highlighting the divergent or path-dependent behavior as inputs approach that location. The key mathematical concepts include limits (including the idea of a limit not existing at a point), local behavior near singularities, and geometric interpretation connected to tangent-related constructions. Construction-wise, it uses GeoGebra primitives such as Point and Segment to define essential points and measurement segments, then builds a function object (f) together with parameter and auxiliary objects (e.g., a, alpha, g, A, B, C, D, h, i, E, F, j, k, l, BigA, p, and equation-related object eq1). These elements are arranged to generate a graph/surface-like visualization that captures what happens to the function near the target point via structured geometric relationships. Suitable for high school to early university learners studying calculus and mathematical analysis, and for classroom demonstrations and explorations of limit existence through dynamic geometry.
GeoGebra Commands & Parameters
Point(xAxis) → aSegment((4 - alpha, 0), (4 + alpha, 0)) → gPoint(g) → APoint(g) → BSegment(A, C) → hSegment(B, D) → iSegment(E, F) → jSegment(E, C) → kSegment(F, D) → lSegment((0, BigA), (0, 100)) → p
AI Drawing Prompt Reference
Describe a graphical representation of a function's behavior near a point. Include points A and B on a horizontal line, separated by alpha. Draw line segments h from A to C and i from B to D. Also include segments j, k, and l connecting E, F, C, and D. A vertical segment p extends from (0, BigA) to (0, 100). Use these geometric relationships to illustrate that the function may not have a limit at point A. The prompt should guide the AI to draw these elements and their connections to help understand the concept of limits.
The prompt above was compiled from the original drawing commands and is for reference only.