
Rational Function Limits Near a Cluster Point
Loading the math board and drawing, please wait…
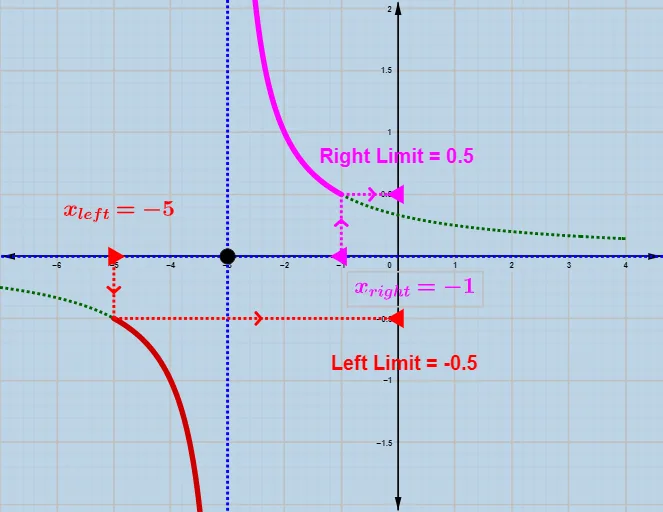
This example uses an interactive GeoGebra applet to visualize how a rational function’s values behave in the neighborhood of a cluster point—either approaching a finite limit or revealing divergence/asymptotic behavior. The key mathematical ideas are limits, rational function behavior near critical points, and the geometric interpretation of continuity versus non-continuity using graph-level evidence. Construction is built with GeoGebra primitives such as Point, Segment, and Asymptote: key points and parameter positions (e.g., P, Q and their primed counterparts) are created and connected with segments to track approach paths, while Asymptote displays the relevant limiting boundary (e.g., vertical/horizontal/oblique behavior). The scene further uses labeled text objects to annotate the tracked values (such as y_P and y_Q) and organizes the workflow around the function and auxiliary objects to show the convergence pattern. Suitable for high-school advanced calculus learning and introductory university calculus, especially for building intuition about limits from graphs.
GeoGebra Commands & Parameters
Point(xAxis) → ASegment((x(A) - 2, 0), A) → iPoint(i) → BSegment(P, P') → hSegment(B, P) → jSegment(A, (x(A) + 2, 0)) → kPoint(k) → CSegment(C, Q) → lSegment(Q, Q') → mAsymptote(u) → l1
AI Drawing Prompt Reference
Draw a coordinate system with horizontal and vertical axes. Connect a point on the left horizontal axis to another point 2 units to the left on the horizontal axis, and then connect this point to another point 2 units to the right on the horizontal axis. Draw a vertical line from the left point to the point 2 units to the left, and another vertical line from the right point to the point 2 units to the right. Mark two points above and below the left vertical line, connect these points to the left point, and also connect them to the right point. Finally, draw an asymptote to show the function's behavior near the critical points.
The prompt above was compiled from the original drawing commands and is for reference only.