
Visualize Mean, Median, IQR, and MAD
Loading the math board and drawing, please wait…
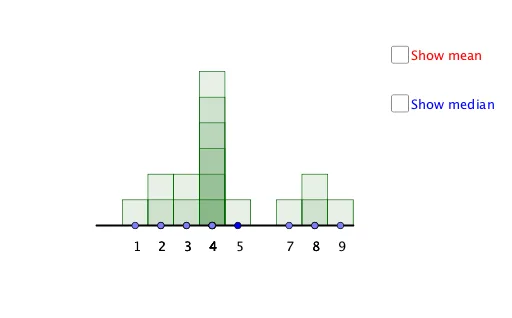
This example allows students to manipulate data points to create different distributions and observe the impact on statistical measures such as mean, median, interquartile range (IQR), and mean absolute deviation (MAD). It involves core concepts like statistical measures and their sensitivity to data distribution. Constructed using commands like Segment, Point, Line, Frequency, Mode, Sequence, Mean, Circle, Intersect, Vector in GeoGebra. Suitable for high school students learning statistics and data analysis.
GeoGebra Commands & Parameters
Segment((0, 0), (9, 0)) → gPoint(g) → MPoint(g) → QPoint(g) → NPoint(g) → LPoint(g) → KPoint(g) → PPoint(g) → CPoint(g) → DPoint(g) → EPoint(g) → FPoint(g) → GPoint(g) → HPoint(g) → IPoint(g) → JPoint(g) → RPoint(g) → OLine(A, B) → fFrequency(list4, list1) → list5Segment((-0.5, 0), (9.5, 0)) → iMode(list1) → list3Mode(list1) → list6Sequence(Sequence[Polygon[(n - 0.5, 0), (n - 0.5, k), (n + 0.5, k), (n + 0.5, 0)], k, 1, Element[list5, n + 1], 1], n, 0, 9, 1) → list2Sequence(abs(list1(n) - Mean[list1]), n, 1, Length[list1]) → L_1Mean(L_1) → madPoint(h) → SCircle(S, mad) → dLine(S, i) → kIntersect(d, k, 1) → TIntersect(d, k, 2) → UVector(S, T) → uVector(S, U) → vPoint(j) → VCircle(V, iqr) → eLine(V, i) → lIntersect(e, l, 1) → WIntersect(e, l, 2) → ZVector(V, W) → wVector(V, Z) → b