
Visualization of the Derivative of a Linear Function
Loading the math board and drawing, please wait…
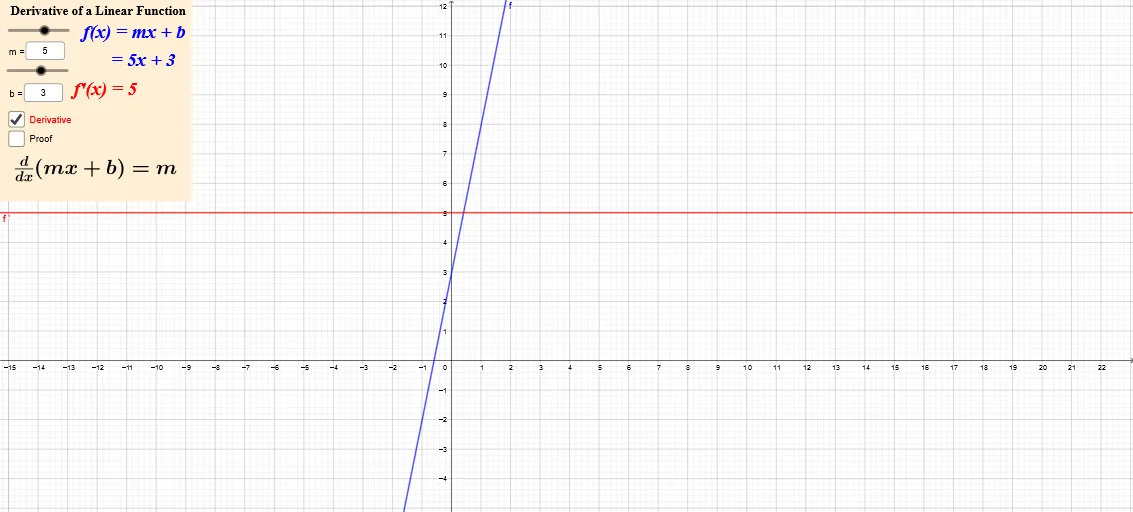
This example demonstrates how the derivative of a linear function corresponds to its constant slope, using interactive parameter inputs to make the relationship between a function’s rate of change and its derivative visually clear. The key mathematical ideas include linear functions, the definition/meaning of the derivative, and the geometric interpretation of the derivative as the slope of the tangent line (which, for a line, stays constant). Construction approach: based on the provided construction summary, the activity relies on the GeoGebra command Textfield together with multiple input fields (e.g., InputBox1 and InputBox2) to set parameters such as m and b, while several text objects (text1–text7) display the relevant variables and computed expressions. This creates an interactive, parameter-controlled graphing setup that updates the displayed results as inputs change. Suitable for late secondary school through early calculus, especially for introducing the concept of derivative and graph-based learning of slope.
GeoGebra Commands & Parameters
Textfield(m) → InputBox1Textfield(b) → InputBox2
AI Drawing Prompt Reference
Visualize a linear function and its derivative with adjustable sliders for slope m and y-intercept b, showing the function graph, derivative graph, and tangent line, with text annotations for key variables and computations, demonstrating the relationship between the derivative and the slope as the slider values change.
The prompt above was compiled from the original drawing commands and is for reference only.