
Visualising Exact Values: Sine & Cosine
Loading the math board and drawing, please wait…
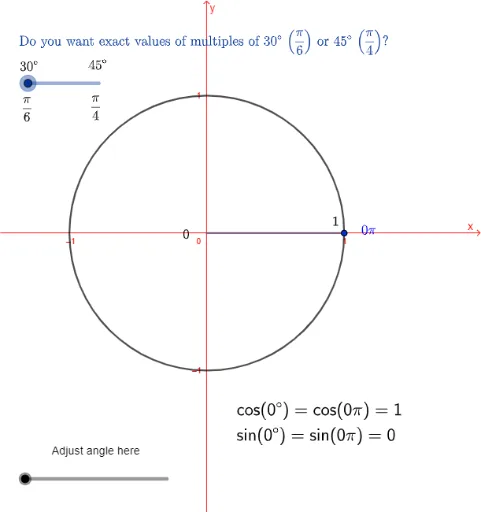
This example visually demonstrates the exact values of sine and cosine functions. It involves core trigonometry concepts, using rotation and angle measurement to intuitively show the properties of sine and cosine. Commands like Segment, SurdText, Angle, Rotate, If, and FractionText are utilized, suitable for high school mathematics education and learning.
GeoGebra Commands & Parameters
Segment((0, 0), P) → angleSurdText(cos(Ang)) → xCoordSurdText(sin(Ang)) → yCoordSegment((0, sin(Ang)), P) → yValSegment((cos(Ang), 0), P) → xValAngle(P) → αRotate(P, 360°, (0, 0)) → P'If(Multiple ≟ 30, π / 6, π / 4) → bFractionText(Angle[P] / (180°)) → β
AI Drawing Prompt Reference
Draw a unit circle centered at the origin. From the origin, draw a ray to the circle's circumference, and mark the angle between the ray and the positive x-axis as α. Draw a point on the x-axis representing cos(α), and another point on the y-axis representing sin(α). Rotate the ray 360 degrees and repeat the process to show sine and cosine values for different angles.
The prompt above was compiled from the original drawing commands and is for reference only.