
Very Basic Log Graph with Adjustable Base
Loading the math board and drawing, please wait…
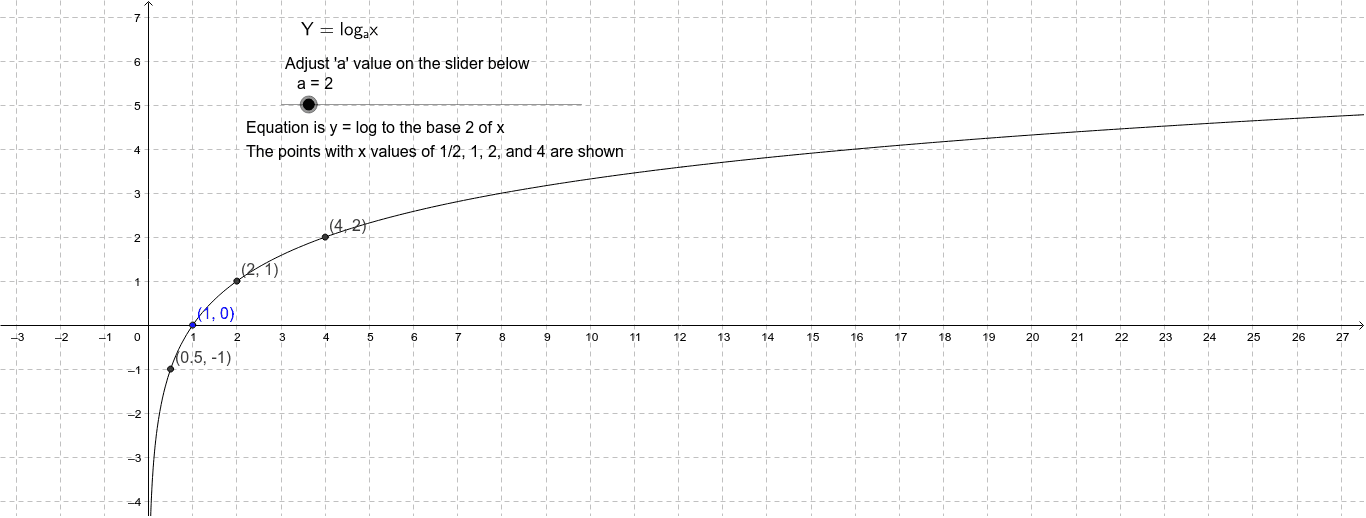
① This example demonstrates a basic logarithmic function graph where the base can be adjusted via a slider, allowing users to observe how changing the base alters the shape and behavior of the curve. ② Core mathematical concepts include the definition of logarithmic functions, the monotonicity for bases greater than 1 versus between 0 and 1, and the invariant point (1,0) on all log graphs. ③ Construction details: Based on the summary, the GeoGebra construction uses a slider object 'a' as the base, defines the function f for the log curve, and employs text objects (text1, text2, text3) to label the expression, key points, or instructions. Points A, B, C, D are created to mark specific locations on the graph for illustration. ④ This is suitable for high school students learning logarithmic functions, as well as for teachers demonstrating the effect of the base on the graph, including connections to exponential functions and inverse relationships.
GeoGebra Commands & Parameters
Numeric a(2.0)f(x) = (1 / log(a) * log(x))(1 / a, -1)Point B(1.0, 0.0)(a, 1)(a^(2), 2)
AI Drawing Prompt Reference
Draw a logarithmic function graph with an adjustable base slider to show how changing the base affects the curve's shape and behavior. Include labeled key points such as the point (1,0) and the asymptote, along with the function expression and base value.
The prompt above was compiled from the original drawing commands and is for reference only.