
Vertical Translation of Function Graphs: f(x)+k Dynamic Demo
Loading the math board and drawing, please wait…
In collections
geometriadinamica.es
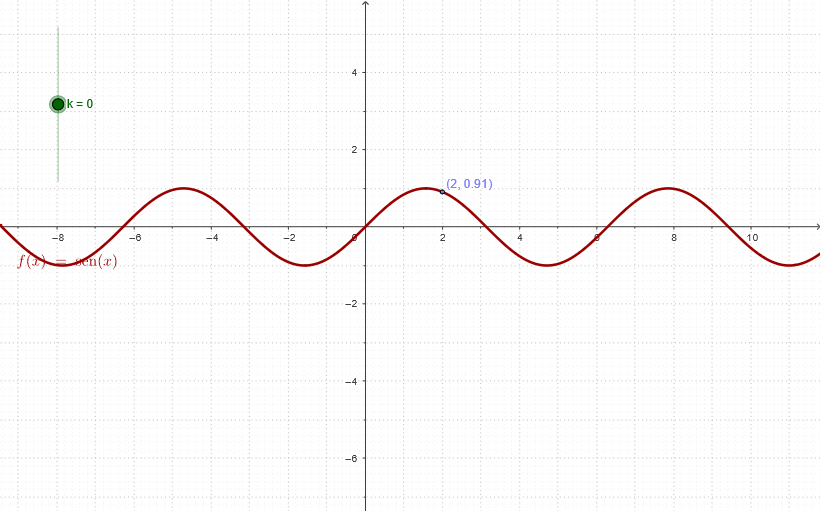
This example demonstrates the vertical translation transformation of function graphs. By using a slider to control parameter k, students can observe how the function f(x) moves upward or downward in real-time. The core mathematical concept is the translation rule: f(x)+k shifts the original graph vertically by |k| units—upward when k>0 and downward when k<0. Construction: Use Point command to create control points, Segment command for auxiliary lines, and slider object k to control the translation amount. Observe the relationship between original function f and translated images T1, T3, T4. Suitable for middle and high school mathematics teaching on function concepts, helping students understand translation rules for logarithmic, trigonometric, and other function types, also serving as an introduction to parameter transformations.
GeoGebra Commands & Parameters
Point(f) → ASegment(C, A) → eSegment(A, B) → a
AI Drawing Prompt Reference
Draw the vertical translation transformation of function f(x). Include the original function f(x), a slider to control parameter k, auxiliary lines, and translated images T1, T3, T4. Observe the relationship between the original function and the translated images. Construction order: first draw the original function f(x), then create the slider to control the translation amount, then draw auxiliary lines, and finally display images in different translation states.
The prompt above was compiled from the original drawing commands and is for reference only.