
Vertical Dilations with Reflections
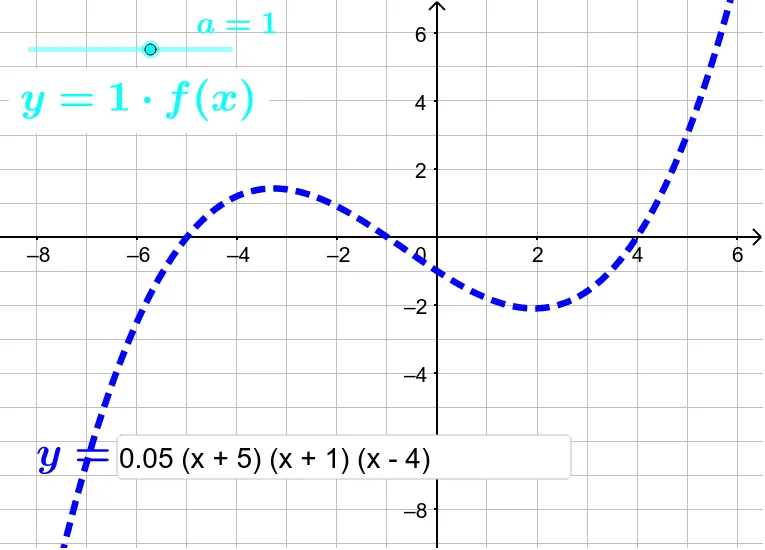
Loading the math board and drawing, please wait…
This GeoGebra example provides an interactive visualization of vertical dilations and reflections applied to linear functions. It demonstrates how changing the coefficient a in a linear equation y = ax + b stretches, compresses, or flips the graph across the x-axisasi. The core mathematical concepts include affine transformations, function scaling, and reflection symmetry. The construction uses the Sequence command to generate multiple transformed lines, a Textfield and InputBox1 for user input of the parameter a, and text objects (text1, text2) to display the current function equations. This resource is ideal for middle school to high school students learning about slope effects on linear graphs, and for teachers demonstrating transformation concepts in algebra or precalculus classes. It supports hands-on exploration of how negative coefficients produce reflections and how magnitude affects steepness.
GeoGebra Commands & Parameters
Sequence(Segment[(i, g(i)), (i, 0)], i, -6, 6, 1.5) → list1Textfield(f) → InputBox1
AI Drawing Prompt Reference
Draw a coordinate plane with x and y axes. Plot a line representing y = a x + b, where a is an adjustable parameter (provide a slider or input box for a). Add vertical line segments from this line down to the x-axis at x-values ranging from -6 to 6 with a step of 1.5. Show the current equation y = a x + b as text. Include a text field or slider for the user to input a, allowing them to see how the line stretches, compresses, or reflects across the x-axis when a changes.
The prompt above was compiled from the original drawing commands and is for reference only.